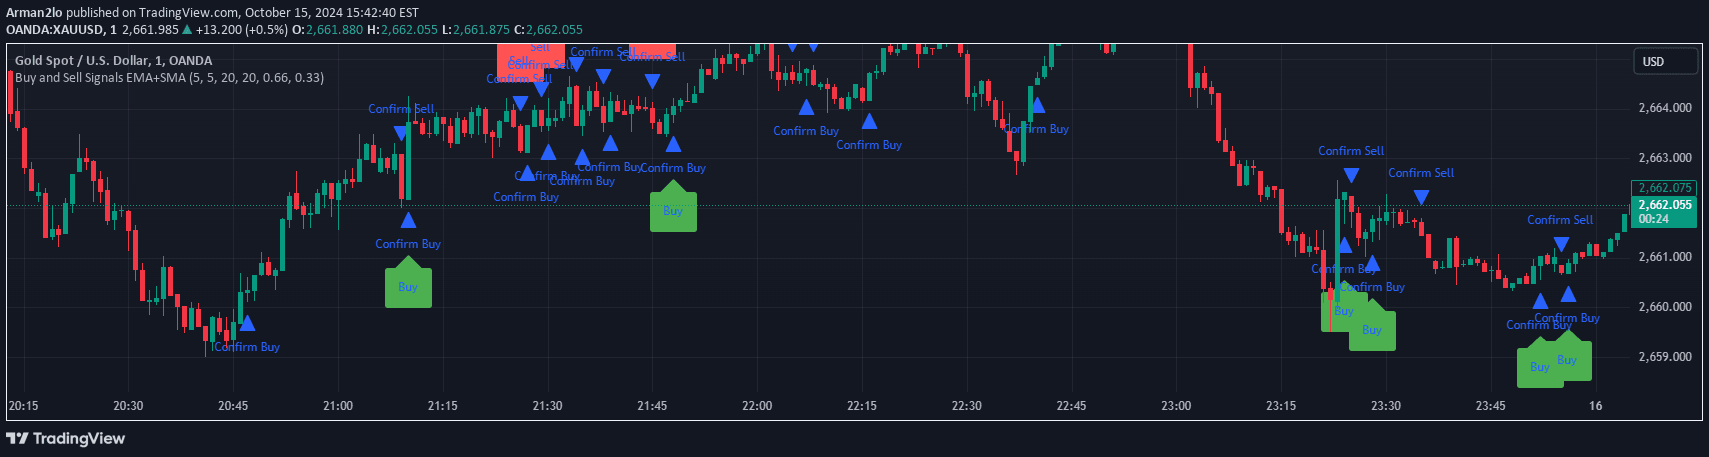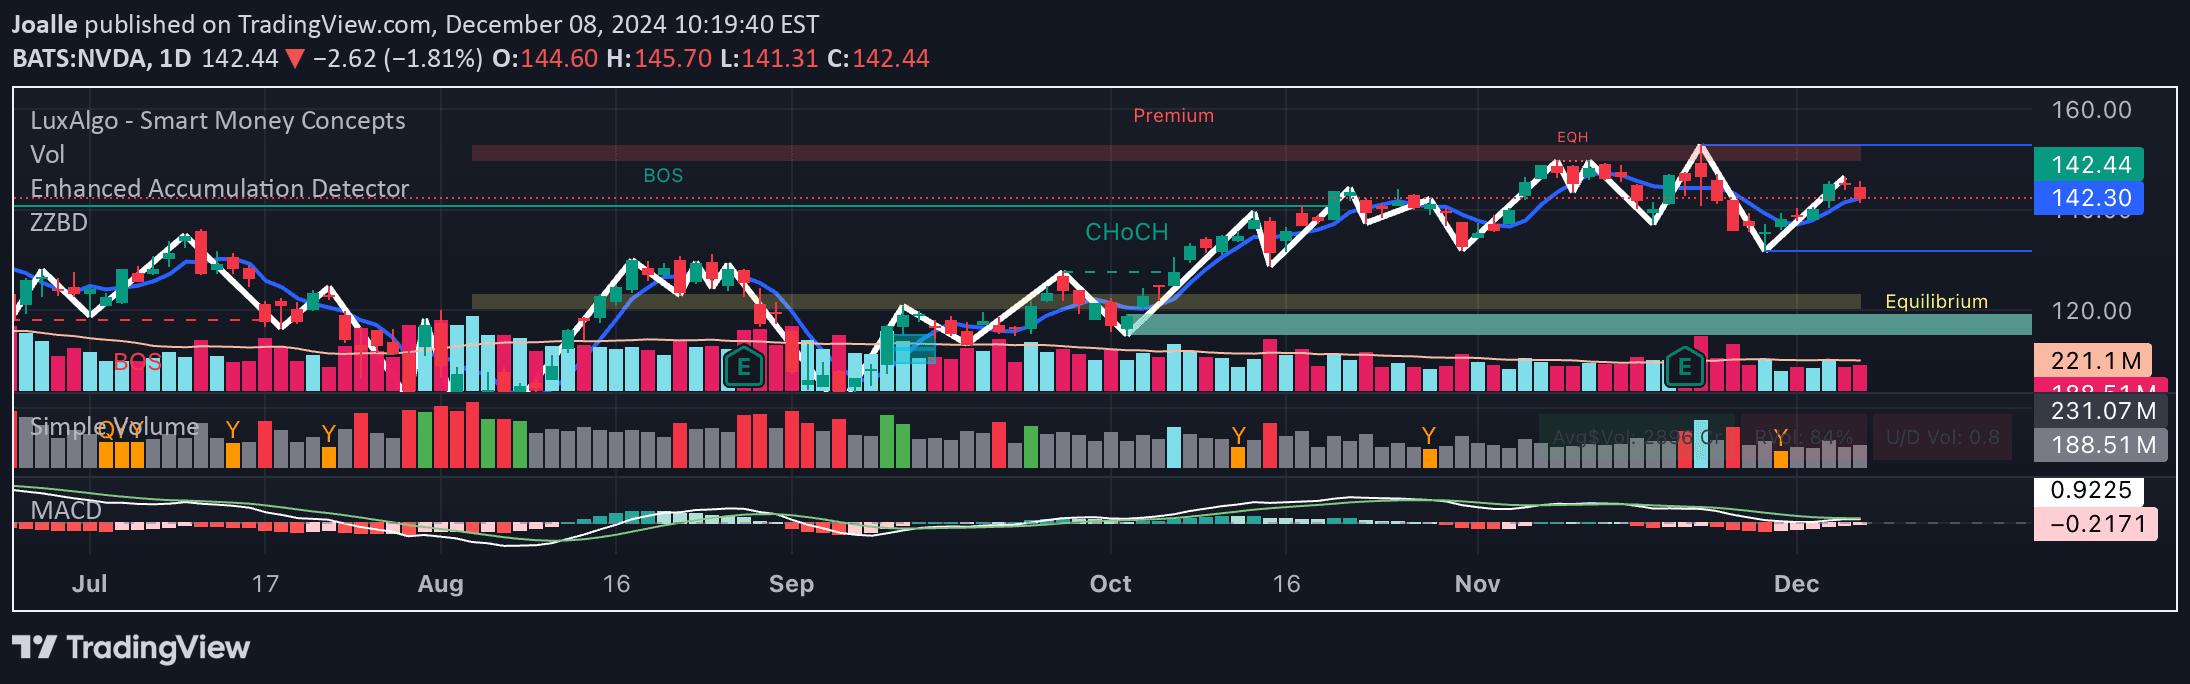
A dynamic trading signal using Simple Moving Average to identify price zones and turning points, helping traders recognize potential trend changes and support/resistance levels.
Explore complementary indicator rolesHow it works
The algorithm begins by calculating a Simple Moving Average (SMA) over a selected period of 5, 10, or 20 candles. It then identifies positive and negative price zones by comparing the current closing price to the SMA, determining whether the price is above or below the moving average.
When transitioning between these zones, the algorithm detects potential turning points by tracking the lowest highs in positive zones and highest lows in negative zones. These turning points are then connected with lines, creating a visual representation of price trend dynamics and potential support and resistance levels.
Why it may be useful
This signal provides traders with a systematic approach to understanding price movements and trend reversals. By dynamically tracking price zones relative to the SMA, it offers insights into potential market sentiment shifts and momentum changes.
The algorithm's ability to connect turning points helps traders visualize price trends more effectively, making it easier to identify entry and exit points. Its flexible SMA period selection allows traders to adapt the indicator to different market conditions and trading styles.
When to explore it
The signal is most effective in markets with clear trend movements and moderate volatility. It works particularly well in short-term trading scenarios where quick identification of trend changes can provide a competitive advantage.
Traders should consider using this signal during periods of consistent price action, such as during trending markets or when trading instruments with relatively stable price characteristics. It is especially useful for technical analysts seeking a dynamic tool to complement other trend-following strategies.
Keep exploring
What we’ve verified
Access, alerts and repainting behaviour have not been independently verified for this indicator. Check the creator’s current publication and settings.
General descriptions and classifications are recovered research. Verified details above identify the specific checks we have completed. Check the creator’s current publication for later changes.