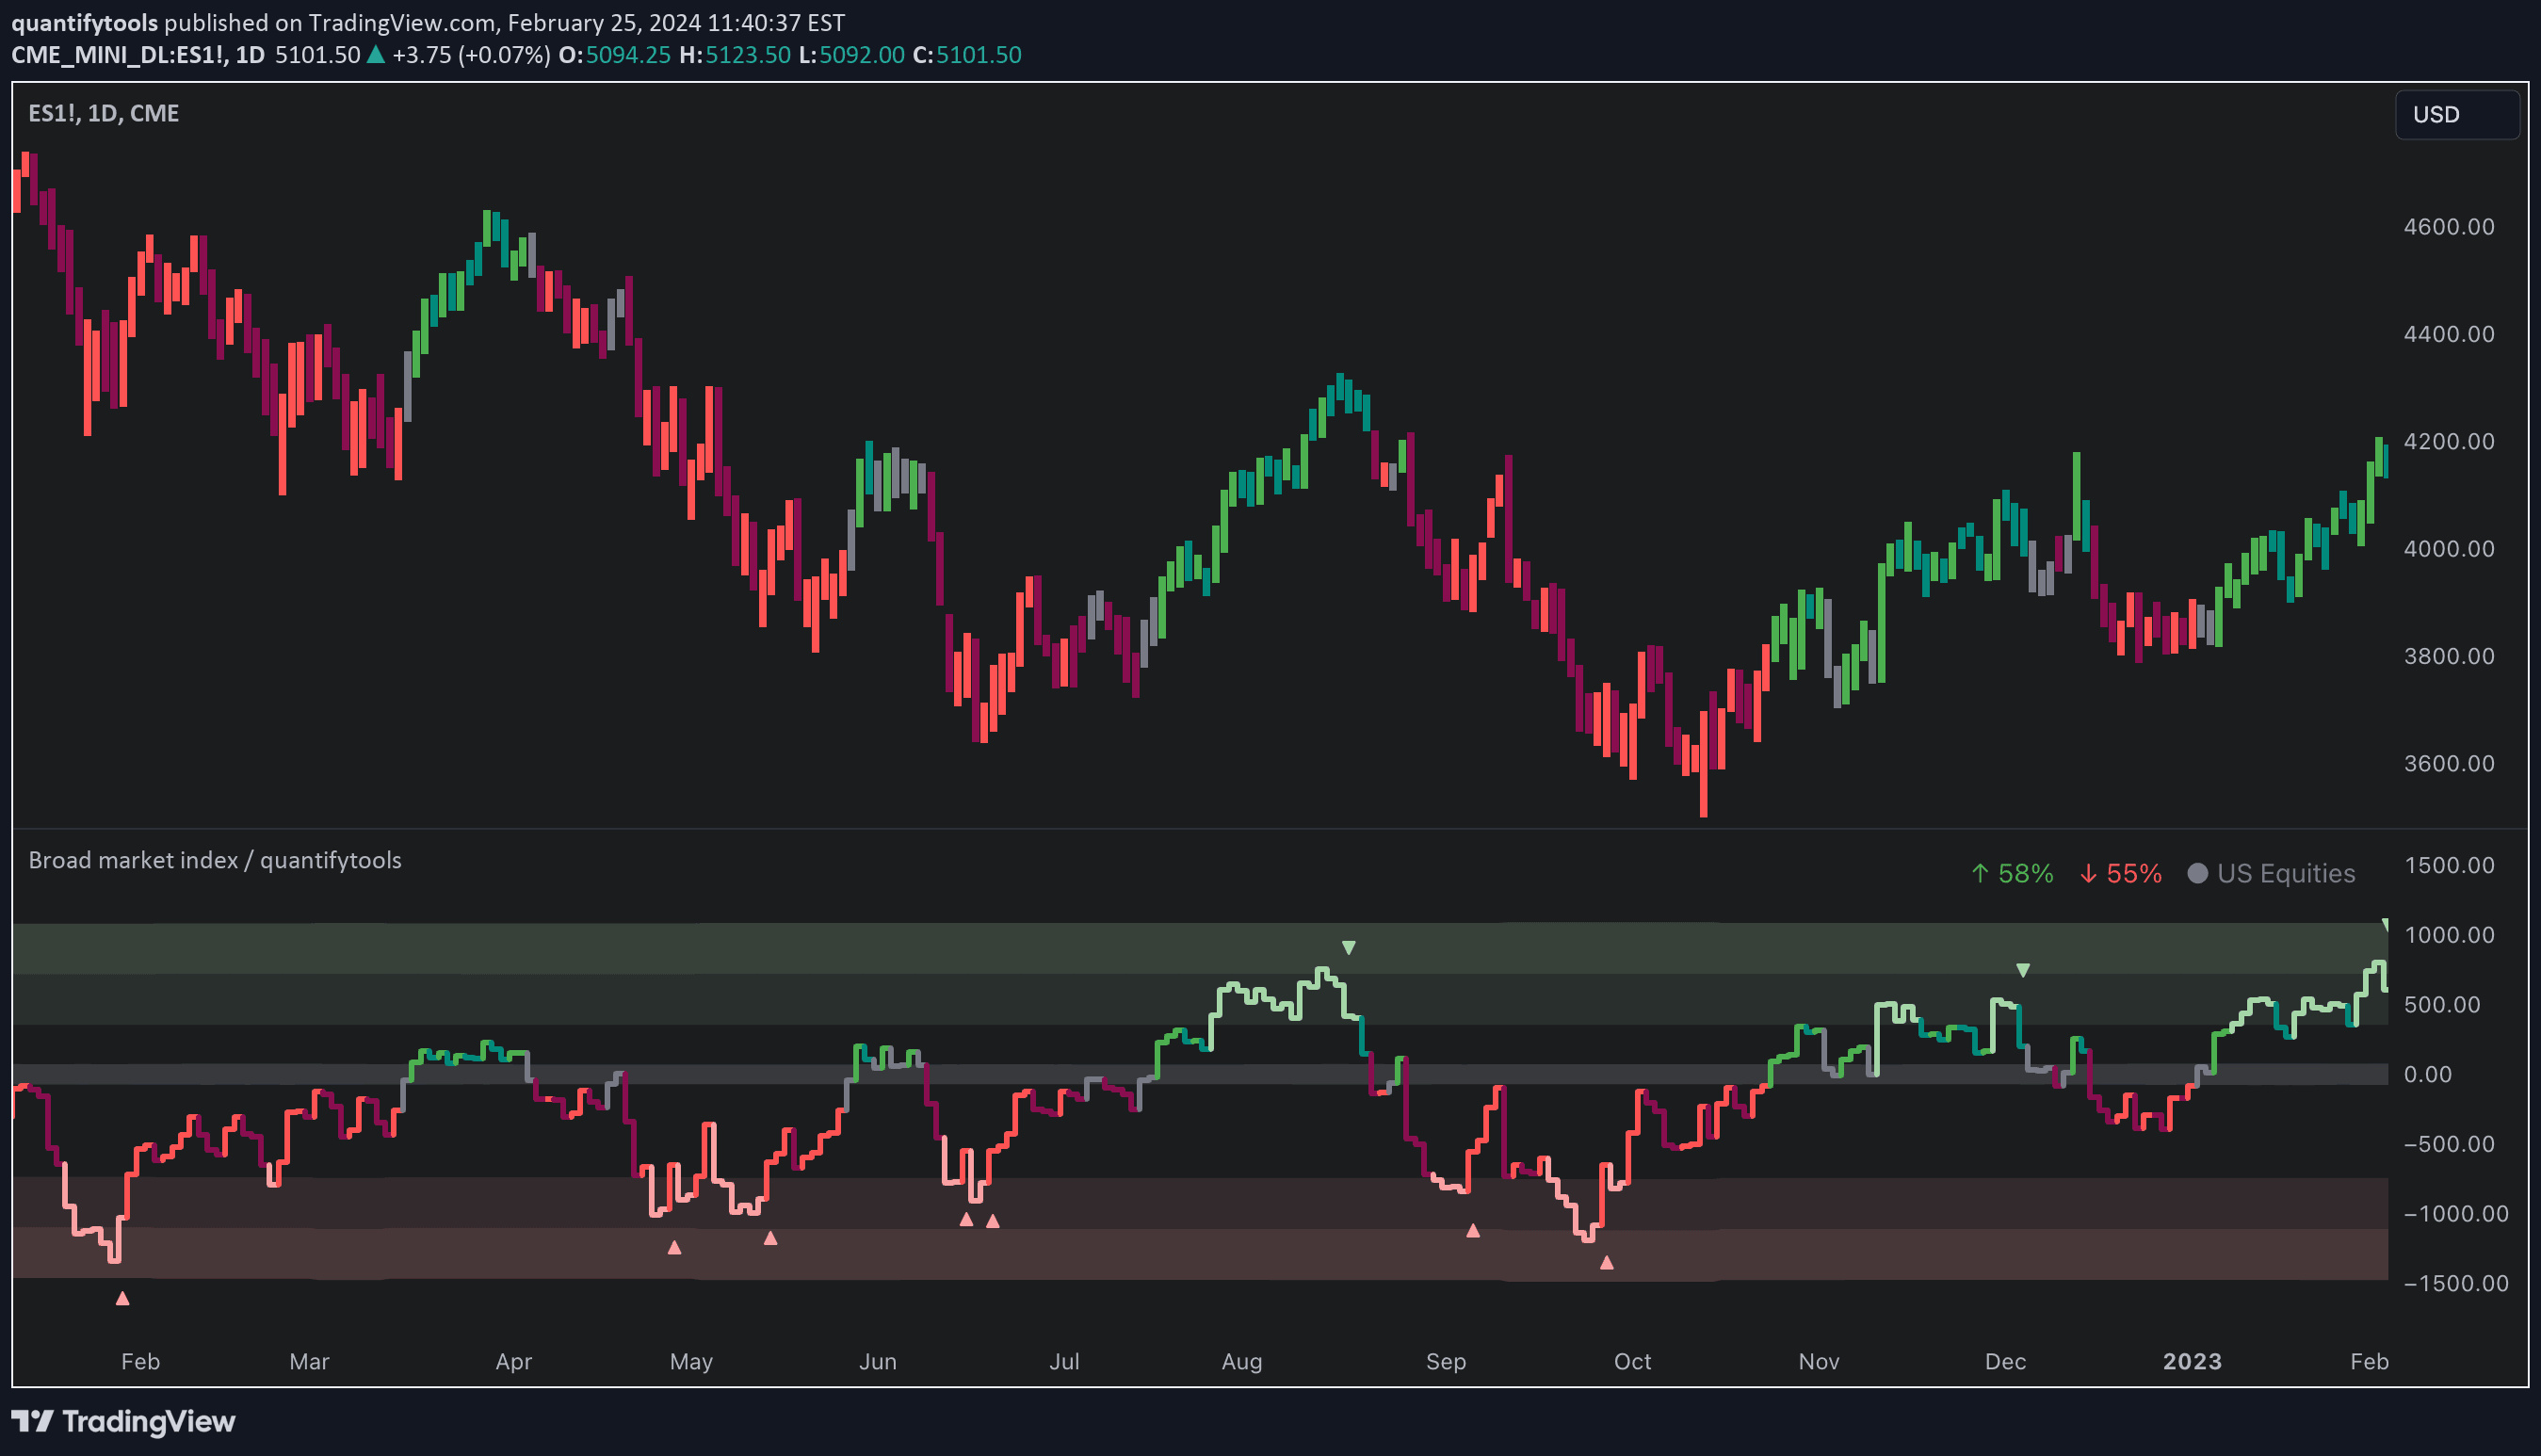
A market breadth indicator tracking the advance/decline ratio of top 20 Nifty stocks to assess overall market strength and sentiment.
Explore complementary indicator rolesHow it works
The Nifty 20 Advance/Decline Ratio Indicator calculates the proportion of advancing stocks versus declining stocks among the top 20 Nifty stocks by market weightage. It tracks the daily performance of these major stocks to create a ratio that indicates market momentum and sentiment. The indicator plots this ratio on a chart, with a neutral reference line at 1 representing an equal number of advancing and declining stocks.
When the ratio is above 1, it suggests more stocks are advancing, indicating bullish market sentiment. Conversely, when the ratio is below 1, it signals more stocks are declining, pointing to bearish market conditions. The daily reset ensures traders have a fresh perspective on market dynamics each trading day.
Why it may be useful
The Advance/Decline Ratio provides crucial insights into market breadth, helping traders understand the underlying strength or weakness of the Nifty market beyond individual stock performance. By analyzing the collective movement of top stocks, traders can gain a more comprehensive view of market sentiment and potential trend directions.
This indicator helps identify whether market movements are broad-based or concentrated in a few stocks. Understanding market breadth can help traders make more informed decisions about overall market conditions. It serves as a valuable tool for confirming trends, detecting potential reversals, and assessing the health of the broader market beyond what price action alone might suggest.
When to explore it
The Nifty 20 Advance/Decline Ratio Indicator is most effective during periods of market uncertainty or potential trend changes. Traders can use it to confirm existing trends or identify potential market reversals by observing shifts in the ratio's movement. It is particularly useful during volatile market conditions when individual stock movements may not provide a clear market direction.
The indicator works best when combined with other technical analysis tools and fundamental market research. Traders should pay special attention to significant deviations from the neutral line, as these can signal important market sentiment shifts. It is particularly valuable for day traders and swing traders looking to understand broader market dynamics before making trading decisions.
Keep exploring
What we’ve verified
Access, alerts and repainting behaviour have not been independently verified for this indicator. Check the creator’s current publication and settings.
General descriptions and classifications are recovered research. Verified details above identify the specific checks we have completed. Check the creator’s current publication for later changes.