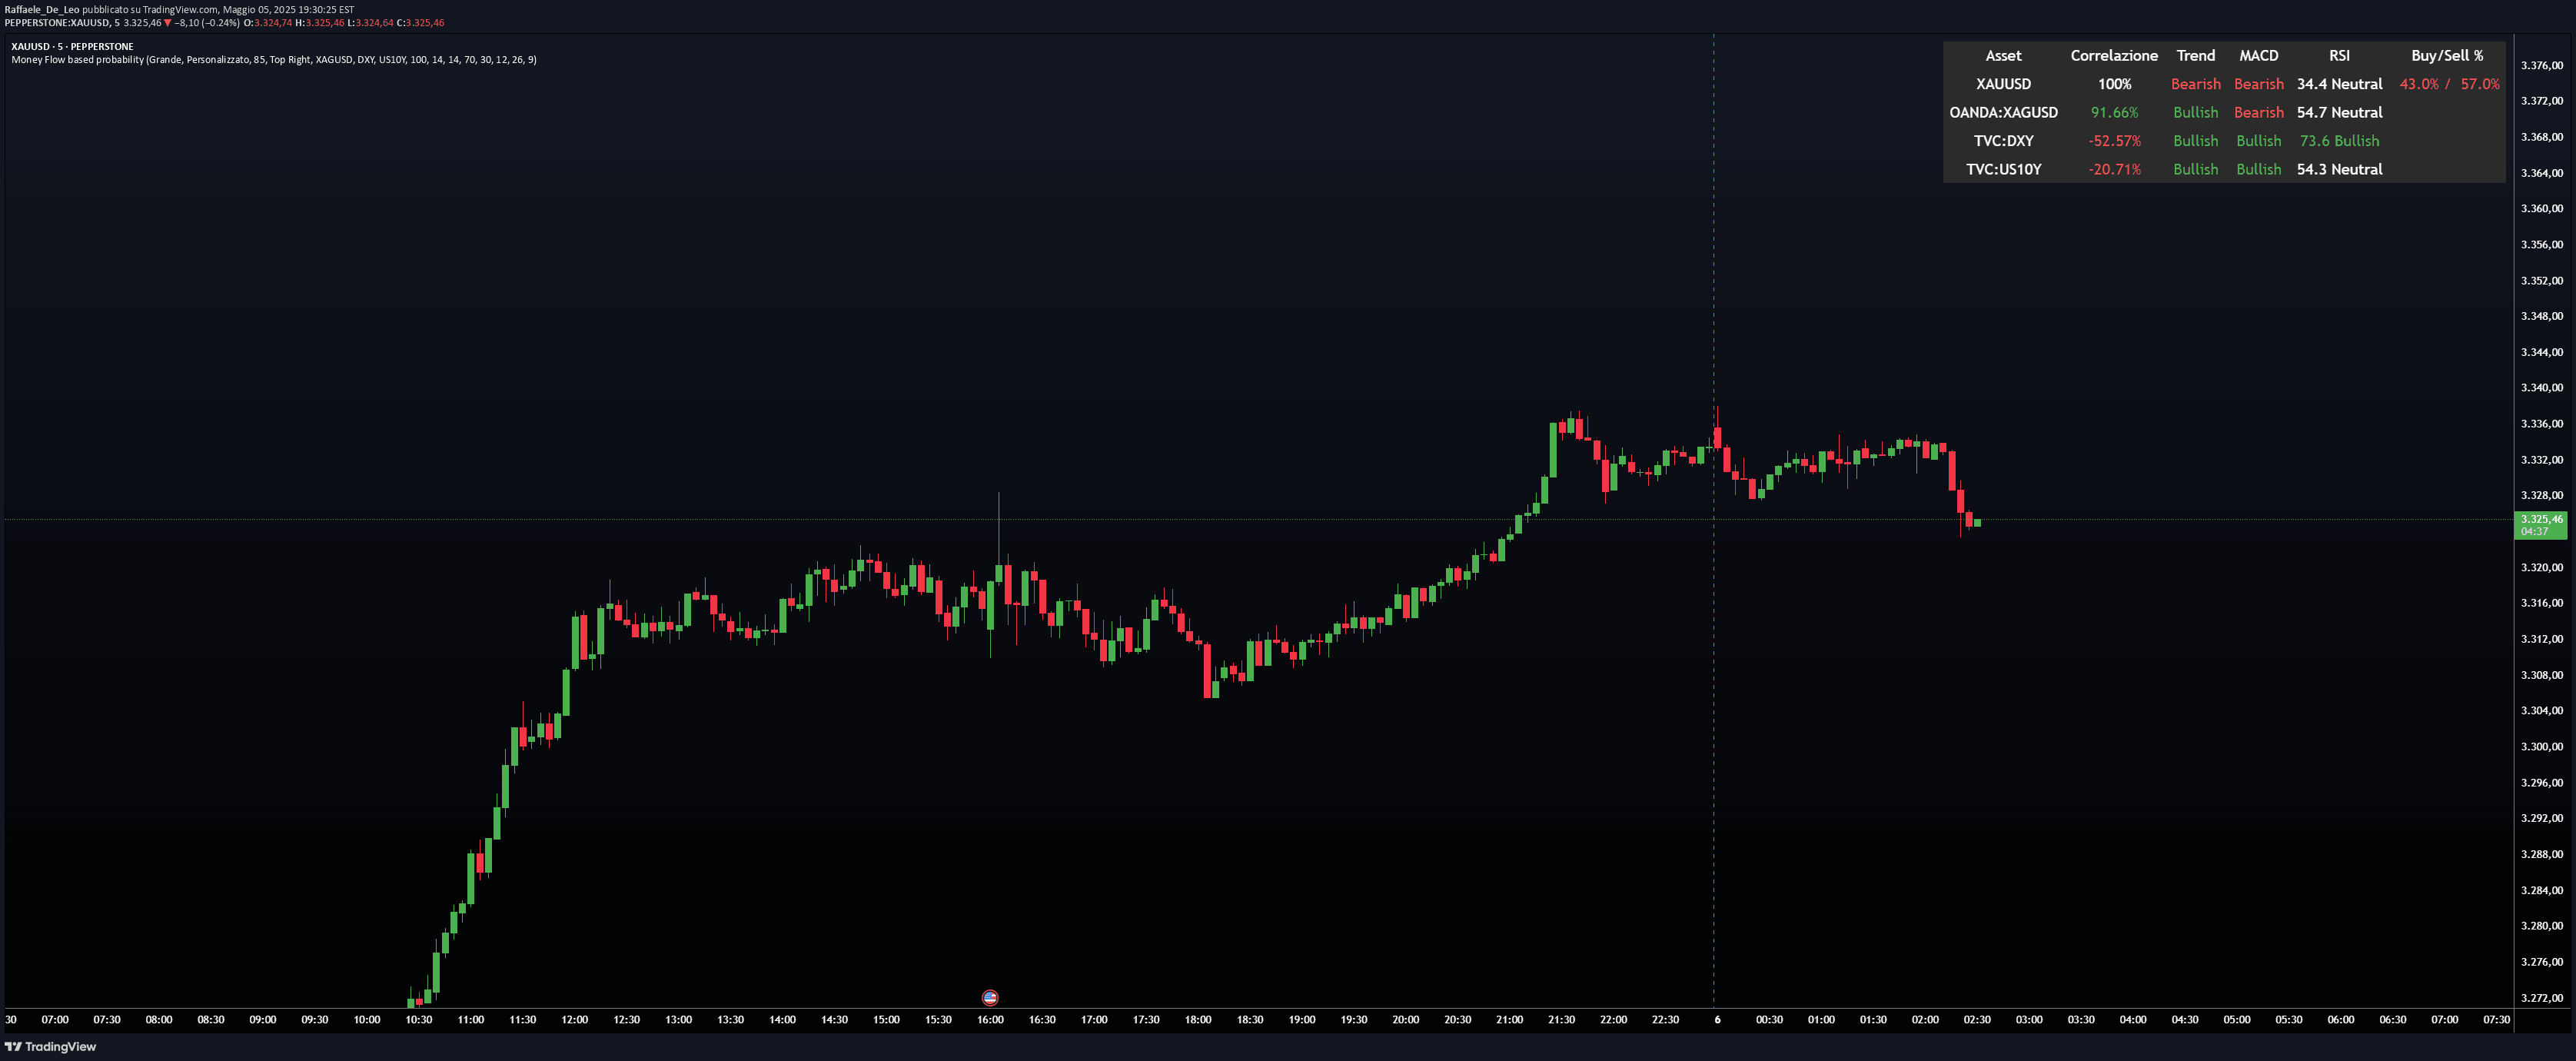
A trading indicator that identifies top market movers by tracking stock performance through a dual-line graphical representation, highlighting bullish and bearish market dynamics.
Explore complementary indicator rolesHow it works
The indicator analyzes and displays the top 10 market pullers and draggers using a graphical interface with two lines representing bullish and bearish market movements. Each line is allocated a maximum of 100 points, tracking the performance and strength of buyers and sellers in the market.
When the green line (buyers) is positioned higher, it indicates strong buying pressure, while a higher red line suggests strong selling pressure. The lines provide a visual representation of market sentiment, with crossovers signaling significant shifts in market dynamics.
Why it may be useful
This indicator offers traders a quick and intuitive method to understand market momentum and sentiment by visualizing the strength of buyers and sellers. It helps traders identify potential trend reversals and market shifts through its unique dual-line representation, allowing for rapid assessment of market conditions.
By limiting the analysis to the top 10 stocks, the indicator provides a concentrated view of market movements, enabling traders to make more informed decisions based on the current market sentiment and potential trend changes.
When to explore it
The indicator is most effective during periods of market volatility when clear trend identification is crucial for making trading decisions. It is particularly useful for traders seeking to understand short-term market dynamics and potential trend reversals across different trading timeframes.
Traders can utilize this indicator during key market events, earnings reports, or economic announcements when stock movements are likely to be more pronounced. It is suitable for scalpers, day traders, and swing traders looking for quick insights into market sentiment and potential trading opportunities.
Keep exploring
What we’ve verified
Access, alerts and repainting behaviour have not been independently verified for this indicator. Check the creator’s current publication and settings.
General descriptions and classifications are recovered research. Verified details above identify the specific checks we have completed. Check the creator’s current publication for later changes.