Fibonacci Optimal Entry Zone [OTE] (Zeiierman)
A precision market structure tool using Fibonacci retracements and Smart Money Concepts to identify optimal entry zones during trending markets with high-probability structural shifts.
Explore 11,183 indicators. Filter beyond the obvious.
Discover the tools that fit the way you trade.
11,183 tools to explore
A precision market structure tool using Fibonacci retracements and Smart Money Concepts to identify optimal entry zones during trending markets with high-probability structural shifts.
Deep Volume provides high-fidelity volume analysis using real-time Tradingview data, offering detailed insights into market dynamics through comprehensive volume metrics and visualization.
A Christmas-themed trading indicator using multiple technical indicators to assess market sentiment by assigning color-coded points across different moving averages and oscillators.
Market Breadth Toolkit providing multiple breadth and thrust measures across NYSE and NASDAQ exchanges, detecting market momentum and potential trend changes using advanced technical analysis methods.
The Deep Crab is a five-point harmonic pattern used to identify potential market reversals by analyzing precise Fibonacci retracement and extension levels.
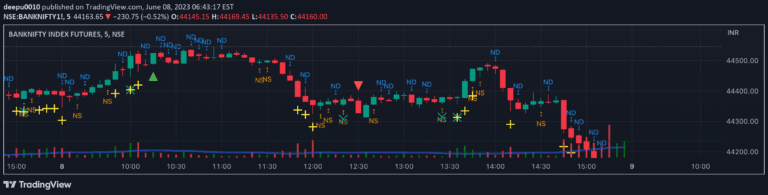
A bank nifty indicator that tracks individual bank contributions and provides visual representation of market strength through lines showing buyer and seller dynamics.
A TradingView indicator that assesses buyer and seller market dominance by analyzing candle volume and price action across specified time segments.
An indicator that automatically draws and connects high and low pivot points on a trading chart, helping traders visualize key price levels without manual plotting.
Breakaway Momentum measures NYSE stock advances versus declines over ten days. When advances exceed 1.97 times declines, it signals a significant market movement.
A trading strategy that identifies and tracks different stock lifecycle stages, analyzing market movements through four distinct phases of stock progression and potential trend changes.
A trading strategy combining RSI and Bollinger Bands to identify potential long signals by analyzing momentum and price movements across multiple timeframes.
Volume Spread Analysis is a trading methodology that examines the relationship between volume, price spread, and market movement to understand smart money intentions and market sentiment.
Likes, views, and comments are historical TradingView snapshots. They describe attention, not trading performance.