
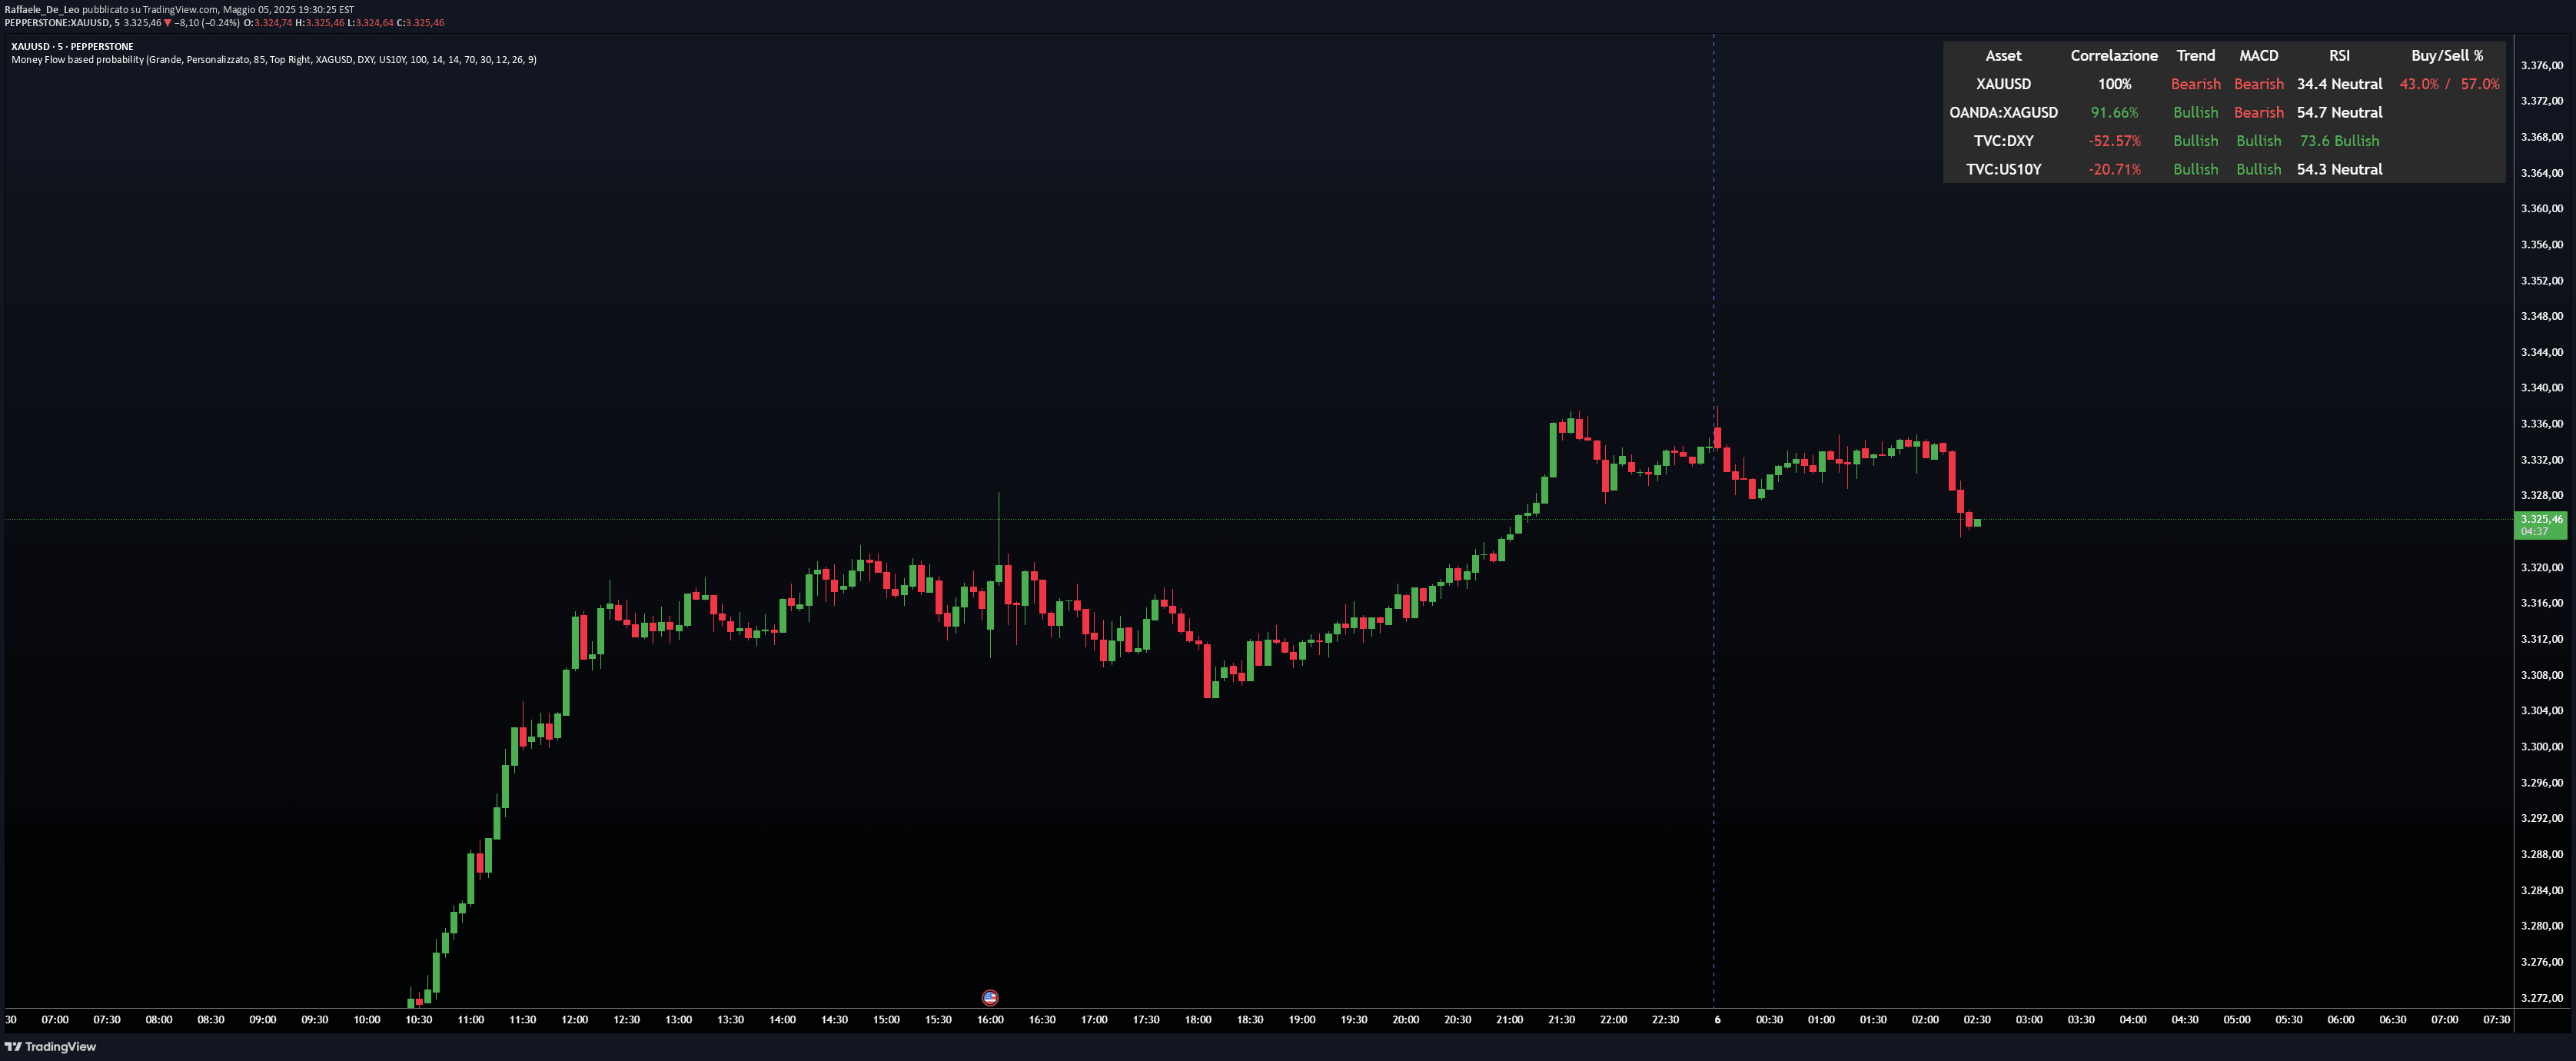
A multi-asset correlation and momentum indicator that combines technical analysis signals to generate buy and sell probabilities across different market instruments.
Explore complementary indicator rolesHow it works
The Money Flow probability indicator operates by selecting and analyzing up to three correlated assets alongside the main trading instrument. It uses advanced statistical techniques like Pine Script's correlation function to measure relationships between closing prices across different timeframes.
The indicator then calculates multiple technical analysis metrics including trend direction via Exponential Moving Averages (EMA), momentum using MACD, and overbought/oversold conditions through RSI. These individual signals are then integrated into a comprehensive weighted scoring system that generates precise buy and sell probabilities for the primary asset.
Why it may be useful
This indicator provides traders with a comprehensive, multi-dimensional view of market dynamics by simultaneously analyzing correlation, momentum, and technical signals across different assets. By consolidating complex technical information into an easy-to-read format, it enables traders to make more informed and nuanced trading decisions.
The ability to quickly assess relationships between different market instruments can reveal hidden trading opportunities and potential market movements that might not be apparent when analyzing a single asset in isolation. This holistic approach helps traders develop a more sophisticated understanding of market interplay and potential trading strategies.
When to explore it
The Money Flow probability indicator is most effective in markets with clear correlational relationships between different assets, such as currency pairs, related indices, or interconnected market sectors. It works exceptionally well for traders seeking a comprehensive, data-driven approach to technical analysis that goes beyond traditional single-asset indicators.
Traders can leverage this tool across various timeframes and market conditions, making it versatile for scalping, day trading, and swing trading strategies. Its strength lies in providing a synthesized view of market dynamics, helping traders identify potential entry and exit points with greater confidence and precision.
Keep exploring
What we’ve verified
Access, alerts and repainting behaviour have not been independently verified for this indicator. Check the creator’s current publication and settings.
General descriptions and classifications are recovered research. Verified details above identify the specific checks we have completed. Check the creator’s current publication for later changes.


