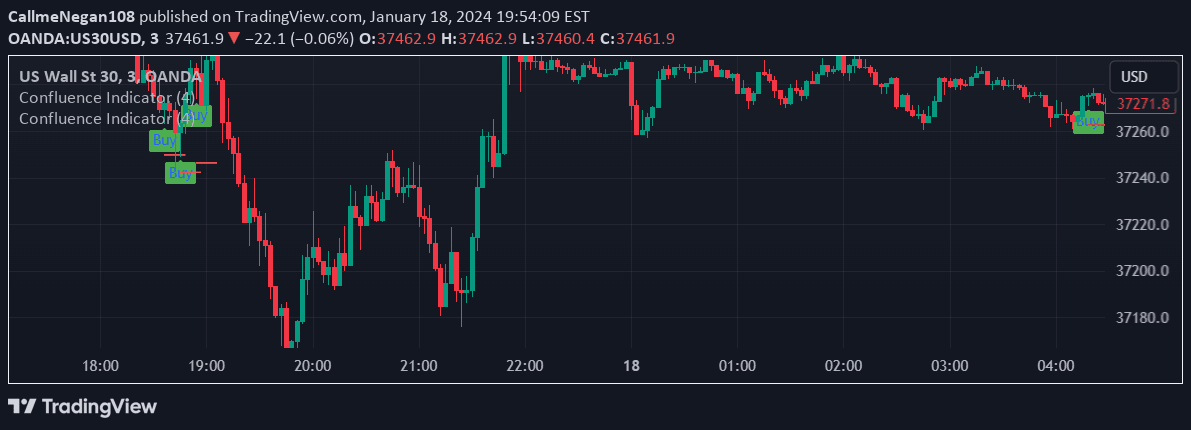
A custom trading indicator that identifies strong bullish and bearish candlestick patterns without wicks, providing visual trading signals through arrows and trend analysis.
Explore complementary indicator rolesHow it works
The indicator first calculates a moving average of chosen length and type, establishing a baseline trend reference. It then identifies specific candlestick patterns characterized by no wicks, where the close is either above or below the moving average, signaling strong price momentum.
When a bullish condition is detected, a green upward triangle is plotted below the candlestick, while a bearish condition triggers a red downward triangle above the candlestick. An additional EMA 20 is plotted for further trend confirmation, and background colors change to provide visual trend cues.
Why it may be useful
This indicator helps traders quickly identify potential trend reversals and strong price movements through its unique no-wick candlestick analysis. By providing clear visual signals and trend context, it enables traders to make more informed decisions about market entry and exit points.
The combination of moving average analysis, candlestick pattern recognition, and directional arrows offers a comprehensive approach to understanding market dynamics, reducing subjective interpretation and providing objective trading insights.
When to explore it
The indicator is most effective in markets with clear, defined trends where price movements show strong directional momentum. It works best on timeframes that allow for precise candlestick pattern identification, such as intraday and short-term charts.
Traders should use this tool in conjunction with other technical analysis methods, considering market volatility, overall trend strength, and additional confirming indicators to validate potential trading signals.
Keep exploring
What we’ve verified
Access, alerts and repainting behaviour have not been independently verified for this indicator. Check the creator’s current publication and settings.
General descriptions and classifications are recovered research. Verified details above identify the specific checks we have completed. Check the creator’s current publication for later changes.