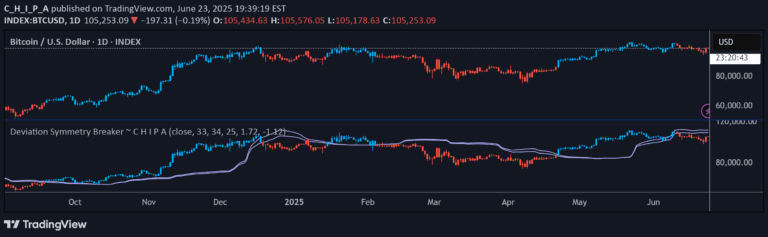
A trading indicator that analyzes price distribution skewness and volatility to identify potential buy and sell zones, offering unique market movement insights.
Explore complementary indicator rolesHow it works
The Normal Distribution Asymmetry & Volatility Zones Indicator operates by calculating the skewness coefficient of price distribution, which reveals the asymmetry of price movements. It determines whether the price distribution is skewed left (negative skewness) or right (positive skewness), providing insights into potential market dynamics.
By combining the skewness analysis with a user-defined volatility threshold, the indicator creates distinct buy and sell zones. When the skewness is negative and prices are below the threshold, it marks buy zones, while positive skewness and prices above the threshold indicate sell zones. Traders can customize parameters like distribution length and volatility sensitivity to suit their specific trading strategy.
Why it may be useful
This indicator provides traders with a sophisticated statistical approach to understanding market behavior beyond traditional price analysis. By examining the asymmetry of price distribution, it offers deeper insights into potential market movements, helping traders identify potential trend shifts and volatility zones that might be overlooked by conventional indicators.
The ability to customize parameters and visually highlight significant zones makes this tool particularly valuable. It transforms complex statistical calculations into actionable trading signals, allowing traders to make more informed decisions by understanding the underlying distribution of price movements.
When to explore it
The Normal Distribution Asymmetry & Volatility Zones Indicator is most effective in markets with clear directional movements and consistent volatility patterns. It works exceptionally well in liquid markets such as major forex pairs, large-cap stocks, and significant index futures where price distributions tend to be more predictable.
Traders should use this indicator in conjunction with other technical and fundamental analysis tools to confirm signals. It is particularly useful during periods of market transition, when traditional trend-following indicators might provide conflicting or delayed signals, offering a unique perspective on potential price reversals and momentum shifts.
Keep exploring
What we’ve verified
Access, alerts and repainting behaviour have not been independently verified for this indicator. Check the creator’s current publication and settings.
General descriptions and classifications are recovered research. Verified details above identify the specific checks we have completed. Check the creator’s current publication for later changes.