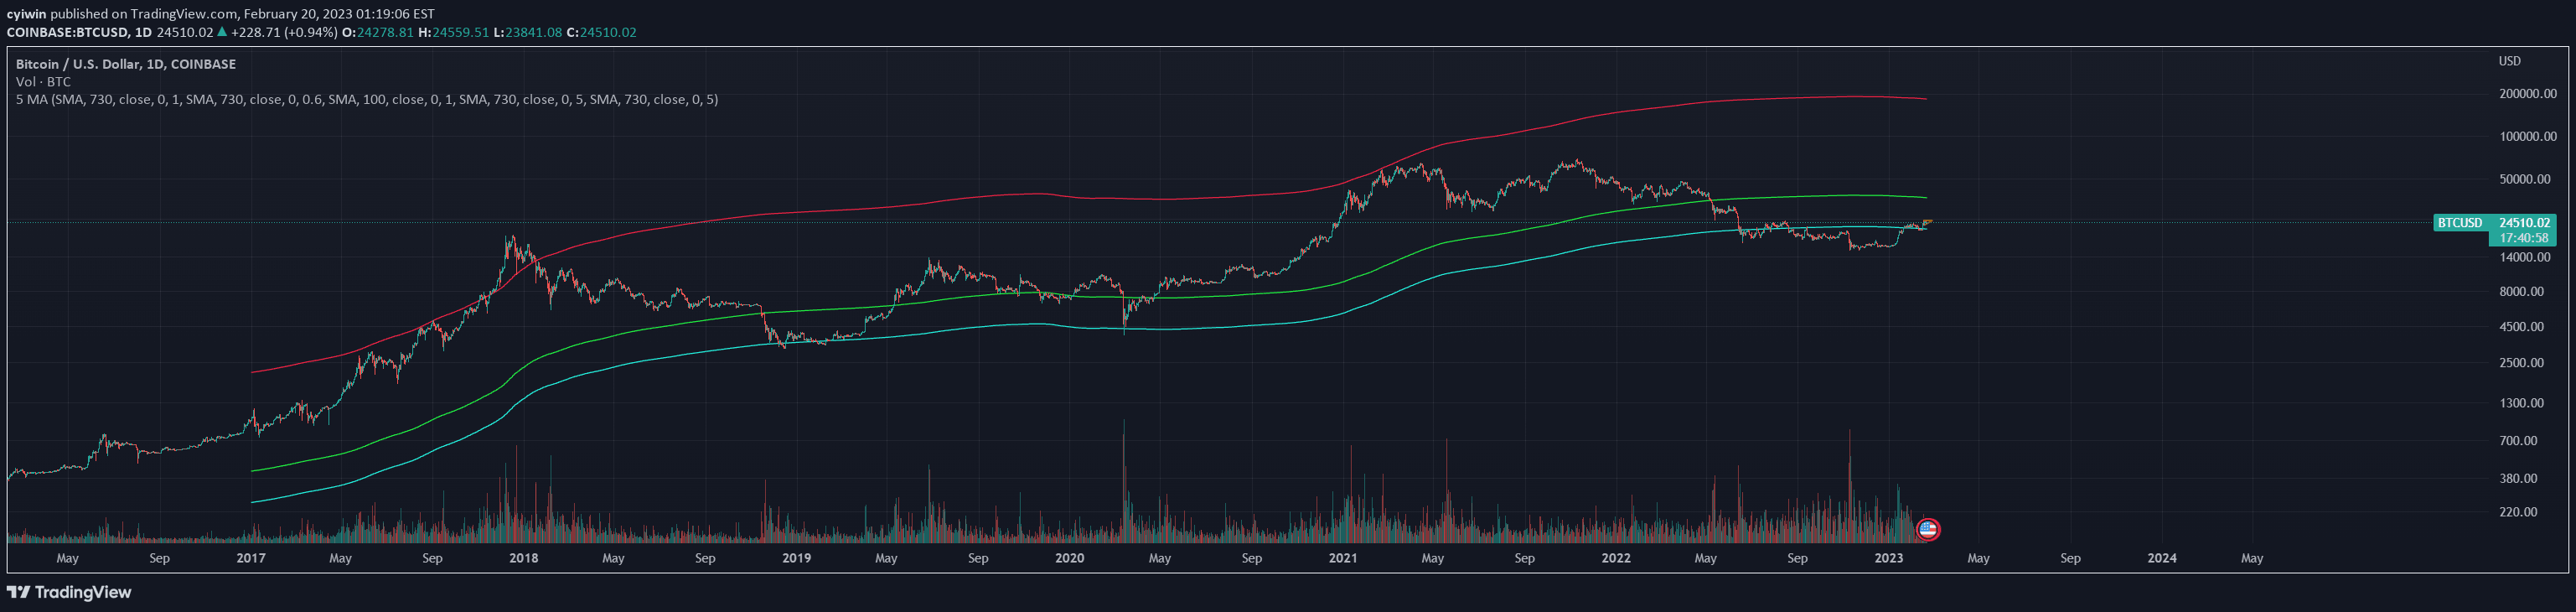
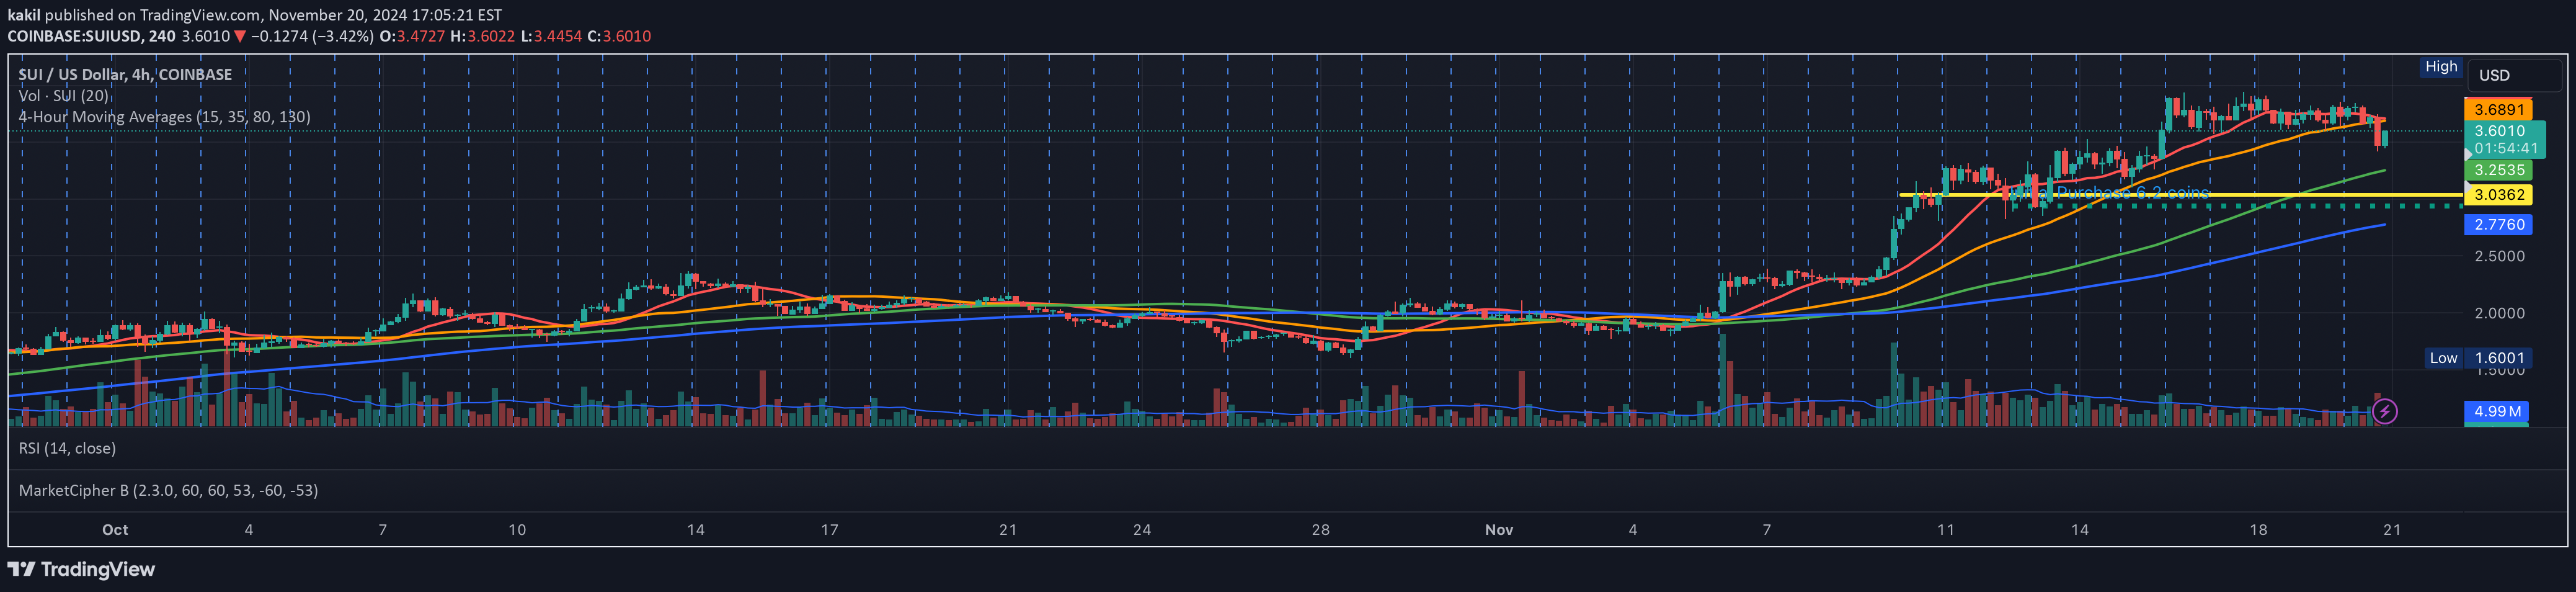
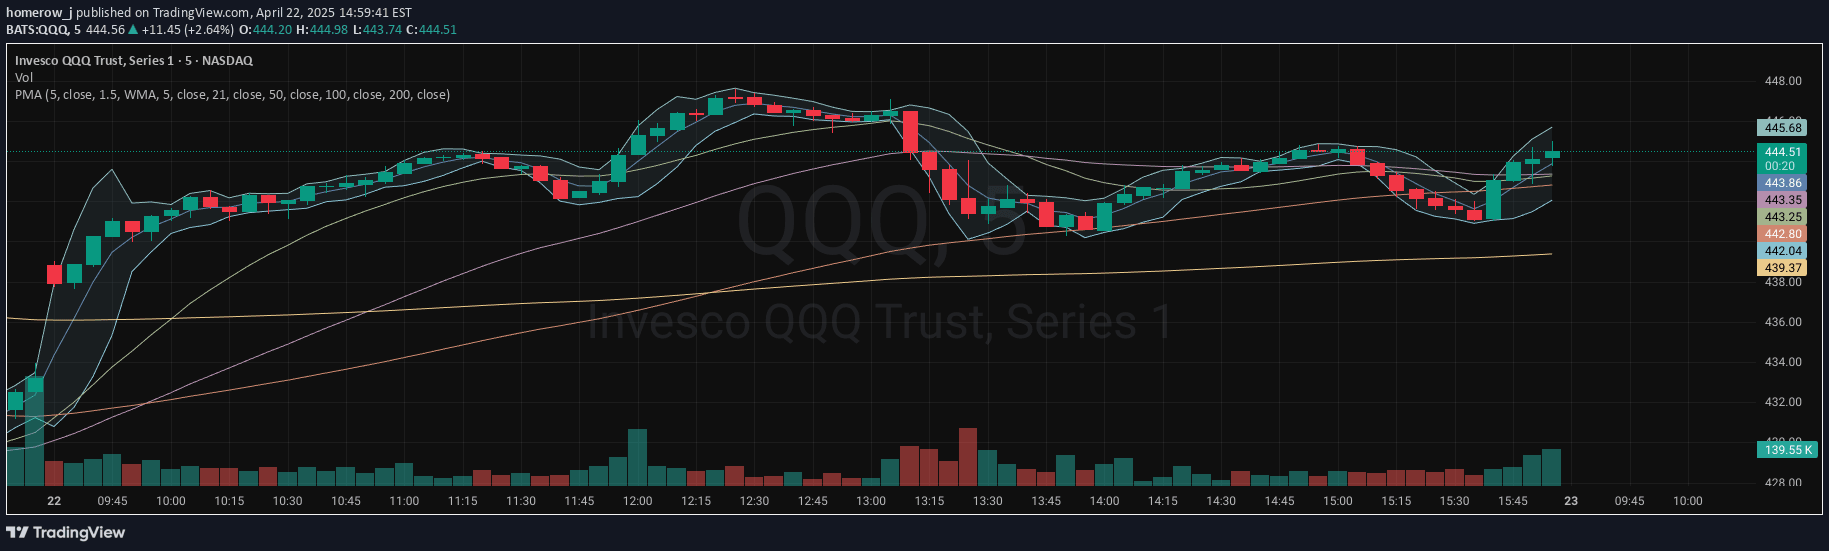
A trading signal that uses six moving averages and calculates an average of their averages to generate a smoothed trend indicator for market direction analysis.
Explore complementary indicator rolesHow it works
The signal begins by selecting six different moving average lengths, such as 10, 20, 30, 40, 50, and 60 periods. These moving averages are calculated independently across the price data to capture different trend perspectives. The indicator then computes the average of these six moving averages, creating a single, more normalized trend line that reduces individual moving average fluctuations.
By averaging multiple moving averages, the signal smooths out short-term price noise and provides a more stable representation of the underlying market trend. This method helps traders identify trend direction more reliably by mitigating the impact of temporary price variations and creating a more consistent trend visualization.
Why it may be useful
This moving average aggregation technique offers traders a more robust trend analysis tool by reducing the potential for false signals that can occur with individual moving averages. By combining multiple periods, the indicator creates a more comprehensive view of market momentum that can help traders make more informed decisions about entry and exit points.
The signal's strength lies in its ability to smooth out market volatility and provide a clearer picture of the overall trend. Traders can use this approach to filter out short-term market noise and focus on more significant price movements, potentially improving their trading strategy's accuracy and reliability.
When to explore it
The signal works best in markets with clear trending characteristics, where price movements show consistent directional momentum across different timeframes. It is particularly effective in liquid markets like major forex pairs, stock indices, and heavily traded commodities where price trends are more pronounced and sustainable.
Traders should consider using this indicator during periods of stable market conditions, avoiding its application during extreme volatility or news-driven market events. The signal is most reliable when used in conjunction with other technical analysis tools and fundamental market analysis to confirm trend direction and potential trade opportunities.
Keep exploring
What we’ve verified
Access, alerts and repainting behaviour have not been independently verified for this indicator. Check the creator’s current publication and settings.
General descriptions and classifications are recovered research. Verified details above identify the specific checks we have completed. Check the creator’s current publication for later changes.