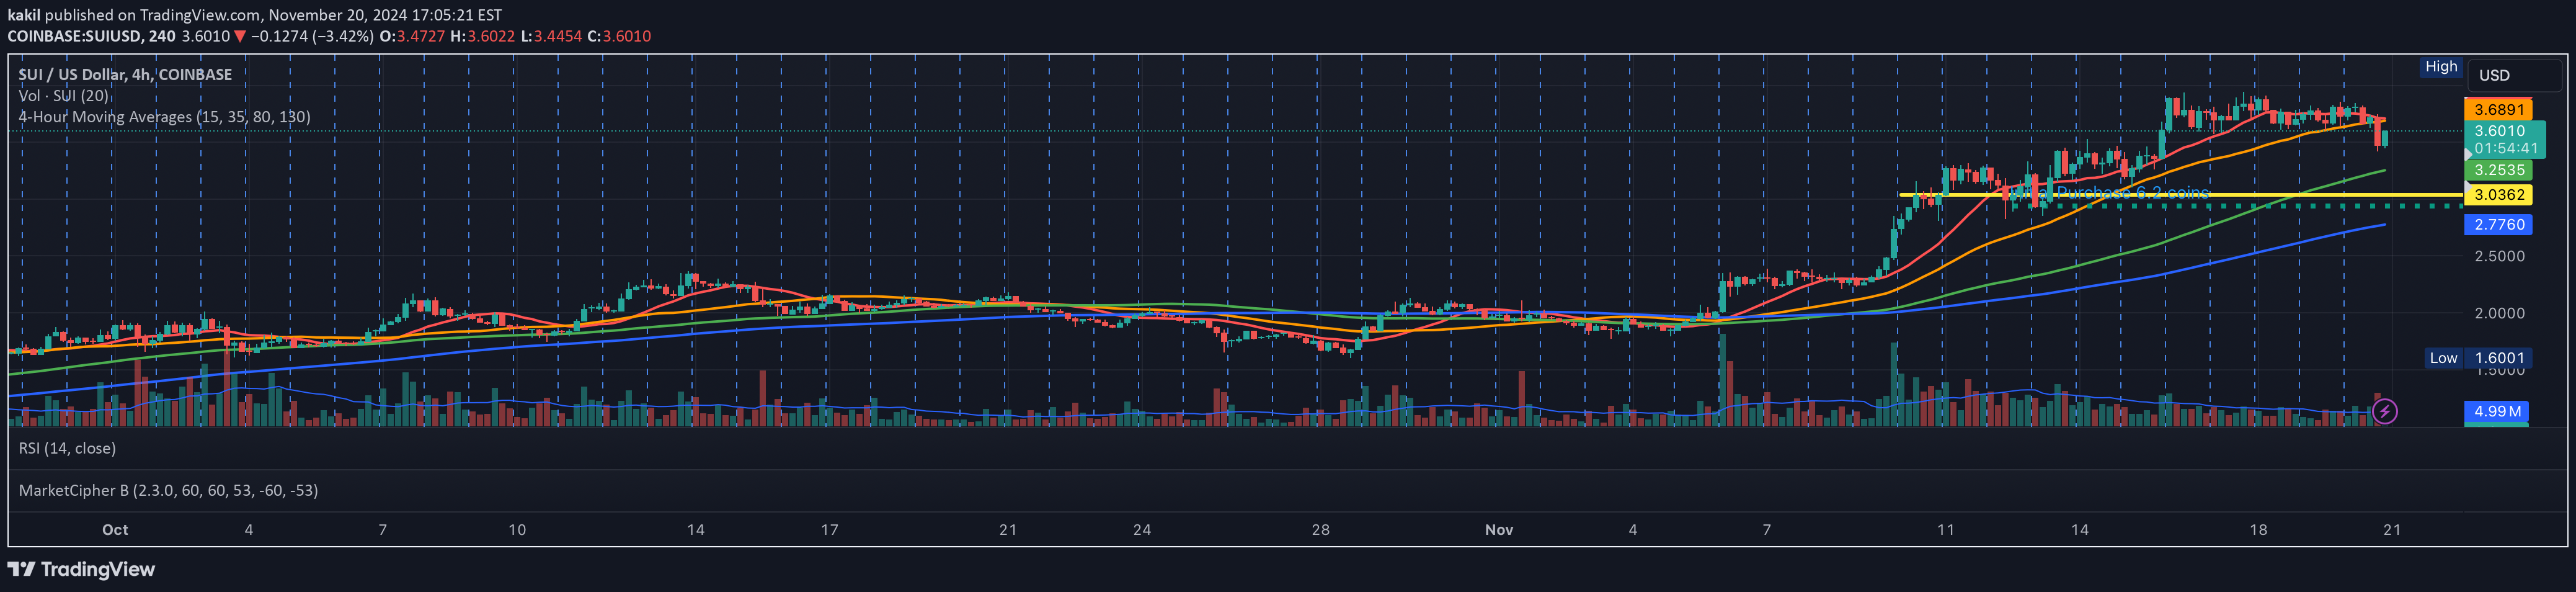
A customizable Rainbow Moving Average indicator using multiple moving average lines to visualize market trends and potential support/resistance levels across different timeframes.
Explore complementary indicator rolesHow it works
The Rainbow Moving Average creates multiple moving average lines using different time periods, typically plotted in rainbow-like color progression. Each line represents a different moving average length, creating a visual representation of trend dynamics and potential price momentum. The lines are calculated using a chosen moving average method, which can be easily customized to suit different trading preferences.
By layering multiple moving averages with varying lengths, traders can identify trend strength, potential trend changes, and key support or resistance levels. The color gradient helps traders quickly interpret market conditions, with closer lines indicating more stable trends and wider separations suggesting potential trend shifts or increased market volatility.
Why it may be useful
Rainbow Moving Averages provide traders with a comprehensive visual tool for understanding market trends and potential price movements. By displaying multiple moving average lines simultaneously, traders can quickly assess trend strength, direction, and potential reversal points. The intuitive color-coded design makes it easier to interpret complex market dynamics at a glance.
The flexibility of this indicator allows traders to adapt it to different trading styles and timeframes, making it a versatile tool for technical analysis. Its simplicity and visual appeal make it particularly useful for both novice and experienced traders seeking to understand market trends more effectively.
When to explore it
Rainbow Moving Averages are most effective in trending markets with clear directional movements, particularly during periods of sustained price momentum. They work well across multiple timeframes, from short-term scalping to longer-term swing trading strategies. Traders can use this indicator to confirm trend directions, identify potential entry and exit points, and assess overall market sentiment.
The indicator is particularly useful during stable market conditions when prices are moving consistently in a specific direction. Traders should be cautious during highly volatile or choppy market periods, as the multiple moving average lines might generate conflicting signals and reduce the indicator's reliability.
Keep exploring
What we’ve verified
Access, alerts and repainting behaviour have not been independently verified for this indicator. Check the creator’s current publication and settings.
General descriptions and classifications are recovered research. Verified details above identify the specific checks we have completed. Check the creator’s current publication for later changes.