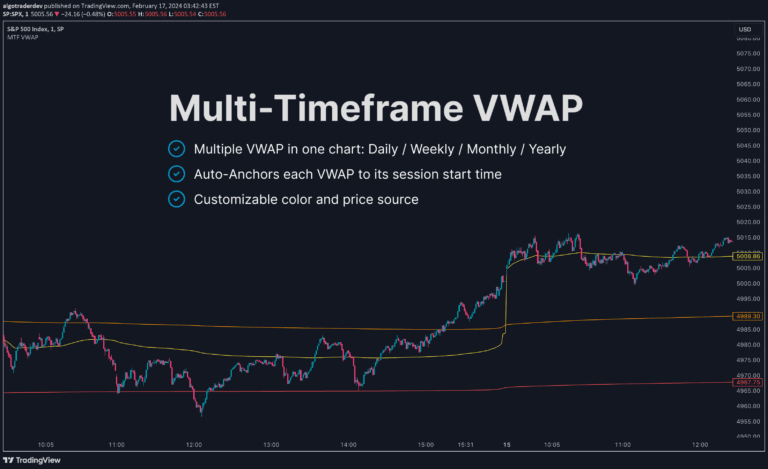
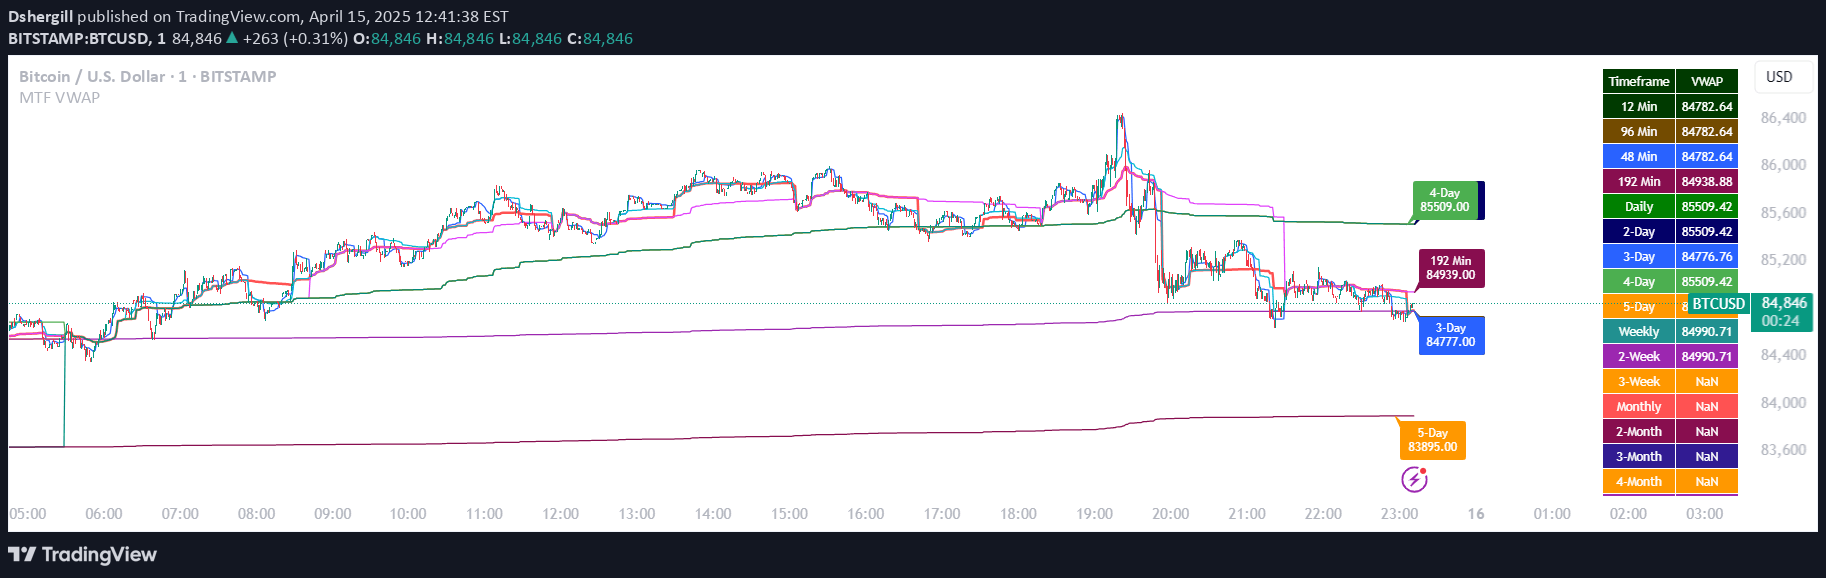
VWAP is a technical indicator that calculates the average price of a security based on both volume and price, providing traders with insights into market trends and value throughout a trading session.
Explore complementary indicator rolesHow it works
VWAP is calculated by multiplying the price of each trade by its volume and then dividing the total by the total volume traded during the day. It starts fresh at the beginning of each trading session, creating a dynamic benchmark that updates in real-time as trades occur.
The calculation involves summing the total dollar value of all trades and dividing it by the total volume. This creates a volume-weighted average that gives more importance to trades with higher volume, providing a more accurate representation of the true average price throughout the trading day.
Why it may be useful
VWAP is crucial for traders because it offers a comprehensive view of a security's price performance, taking into account both price and volume. It helps traders understand the true average price and identify whether current prices are above or below the day's average trading price.
By providing a clear benchmark, VWAP helps traders make more informed decisions about entry and exit points. Institutional investors and algorithmic trading systems often use VWAP as a key reference point for executing large trades efficiently and minimizing market impact.
When to explore it
VWAP is most effective for intraday trading strategies, particularly in highly liquid markets with consistent trading volume. It works best for traders looking to gauge the overall market sentiment and compare current prices to the day's average trading price.
Traders can use VWAP to identify potential trend reversals, support and resistance levels, and to assess the quality of trade executions. It is particularly useful for short-term traders who need a real-time indicator of market dynamics and price performance.
Keep exploring
What we’ve verified
Access, alerts and repainting behaviour have not been independently verified for this indicator. Check the creator’s current publication and settings.
General descriptions and classifications are recovered research. Verified details above identify the specific checks we have completed. Check the creator’s current publication for later changes.