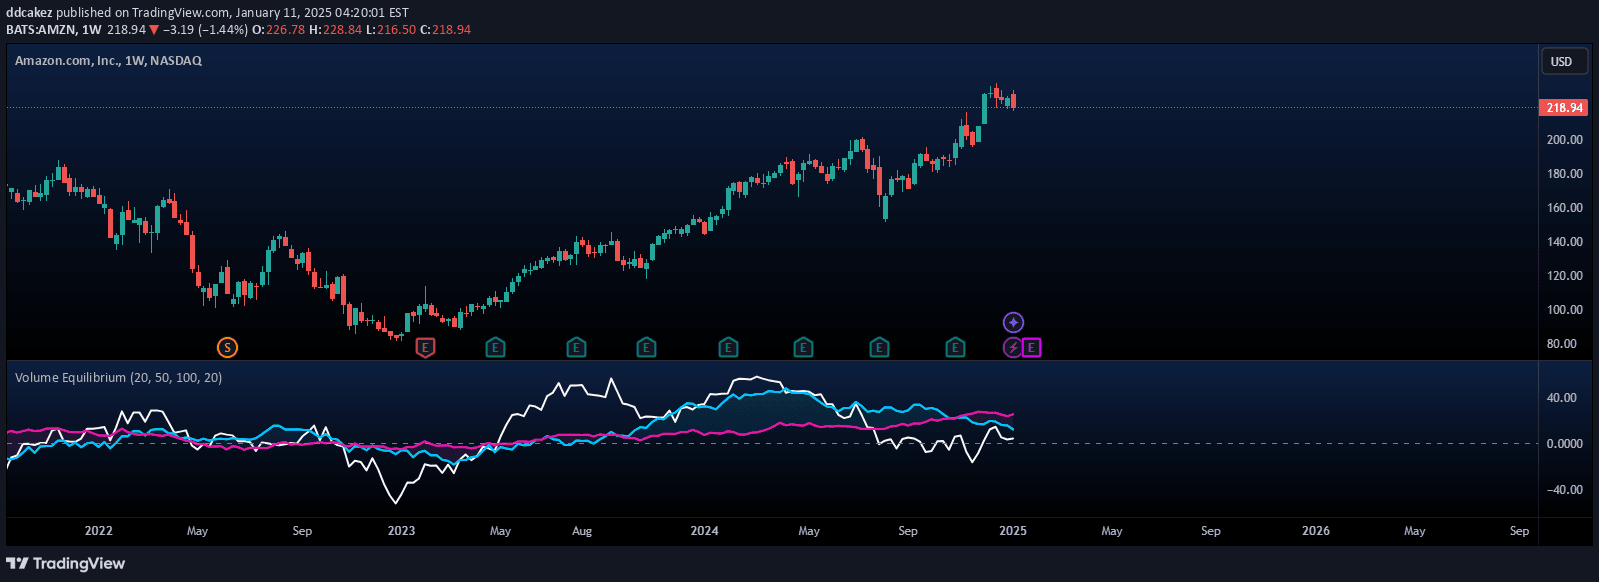
A two-sided histogram indicator that compares up volume and down volume, revealing market sentiment and buying or selling pressure across different timeframes.
Explore complementary indicator rolesHow it works
The UVOL/DVOL Two-Sided Ratio Histogram calculates the ratio between up volume and down volume dynamically for any selected chart timeframe. When up volume exceeds down volume, the indicator displays a positive bar representing the volume ratio, and when down volume is higher, it shows a negative bar representing the inverse ratio.
The histogram is centered around a zero line, providing a clear visual representation of volume dominance. Positive bars indicate stronger buying pressure, while negative bars suggest increased selling pressure, allowing traders to quickly gauge market sentiment through volume analysis.
Why it may be useful
This indicator provides traders with an immediate, intuitive understanding of market dynamics by visualizing the relative strength of buying and selling volume. By comparing up volume to down volume, traders can gain insights into potential trend reversals, market sentiment shifts, and underlying price movement momentum.
The two-sided histogram offers a unique perspective on market psychology, helping traders identify periods of significant buying or selling pressure. This visual tool can complement other technical analysis methods, providing an additional layer of confirmation for trading decisions and potential entry or exit points.
When to explore it
The UVOL/DVOL Two-Sided Ratio Histogram is most effective during periods of significant market activity and when traders want to assess volume-based market sentiment. It works particularly well in volatile markets where volume can provide critical insights into potential trend changes and market participant behavior.
Traders can utilize this indicator across various timeframes, from short-term scalping to longer-term swing trading, making it a versatile tool for understanding market dynamics. It is especially useful when combined with other technical indicators to confirm potential trading signals and assess the strength of price movements.
Keep exploring
What we’ve verified
Access, alerts and repainting behaviour have not been independently verified for this indicator. Check the creator’s current publication and settings.
General descriptions and classifications are recovered research. Verified details above identify the specific checks we have completed. Check the creator’s current publication for later changes.