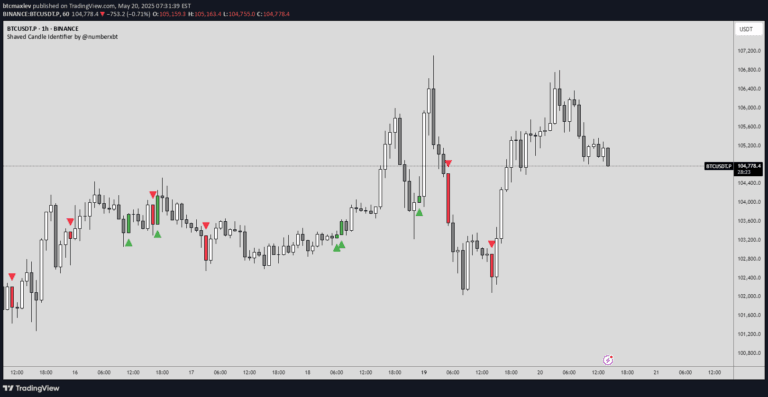
A dynamic OBV candlestick chart that transforms volume analysis by integrating price action signals, allowing traders to visualize volume dynamics more comprehensively.
Explore complementary indicator rolesHow it works
The OBV candlestick chart transforms traditional volume tracking by representing volume data through candlestick patterns instead of a simple line. Each candlestick reflects volume accumulation and distribution, with the size, color, and shape indicating the intensity of buying or selling pressure in the market.
The chart tracks cumulative volume, adding volume on up days and subtracting volume on down days to create a comprehensive volume profile. By converting this data into candlesticks, traders can more intuitively interpret volume trends, seeing how volume interacts with price movements and identifying potential market turning points.
Why it may be useful
The OBV candlestick chart provides traders with a more nuanced understanding of market dynamics by visually representing volume data. It helps identify institutional activity, liquidity changes, and potential trend reversals that might be missed with traditional volume indicators.
By offering a granular view of volume-price relationships, this approach enables traders to make more informed decisions. The enhanced visualization allows for better detection of momentum shifts, support and resistance levels, and potential breakouts or breakdowns in the market.
When to explore it
The OBV candlestick chart is most effective during periods of significant market movement, such as trending markets or during potential trend reversal scenarios. It works particularly well when traders want to confirm the strength of a current price trend or identify potential trend exhaustion.
Traders should utilize this tool when seeking to understand the underlying volume dynamics driving price action. It is especially useful in volatile markets, during major economic announcements, or when analyzing stocks and financial instruments with complex price movements.
Keep exploring
What we’ve verified
Access, alerts and repainting behaviour have not been independently verified for this indicator. Check the creator’s current publication and settings.
General descriptions and classifications are recovered research. Verified details above identify the specific checks we have completed. Check the creator’s current publication for later changes.