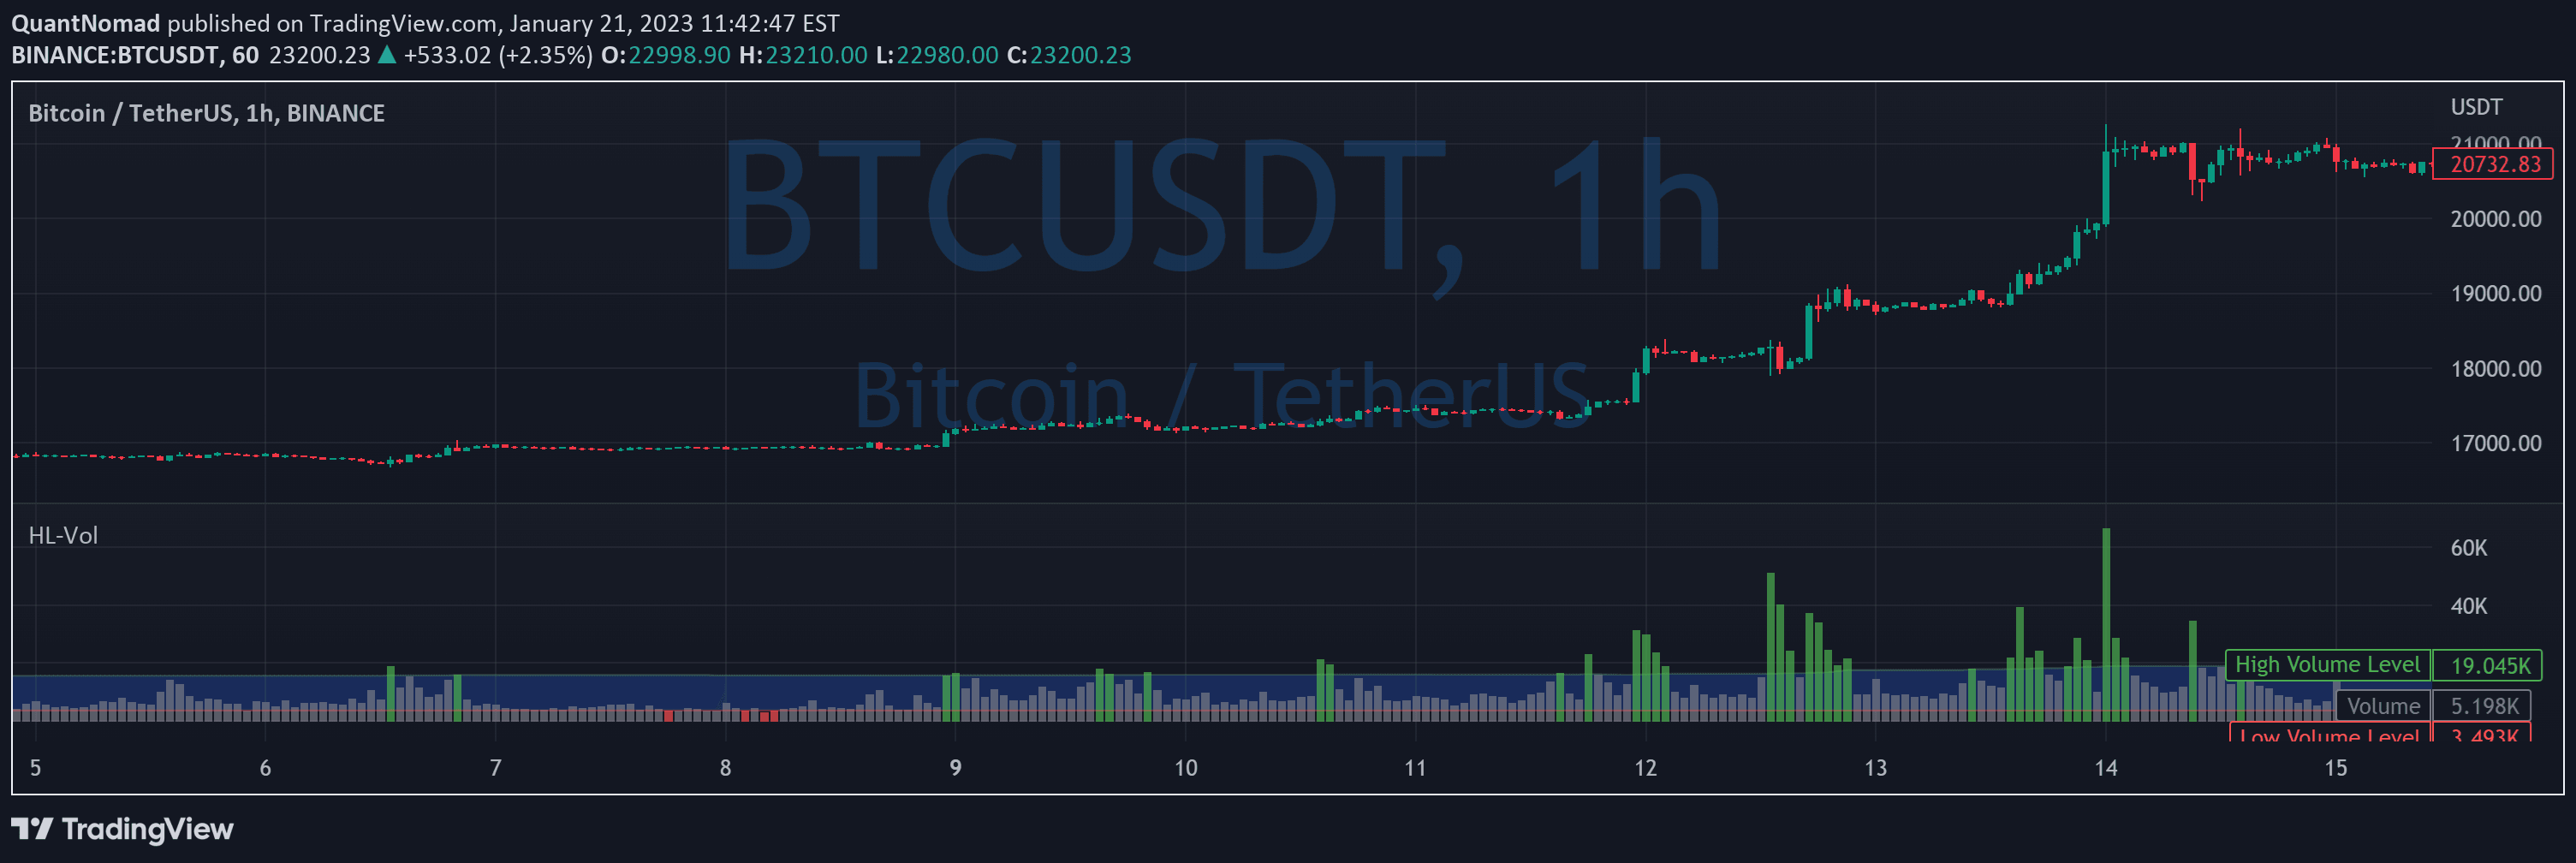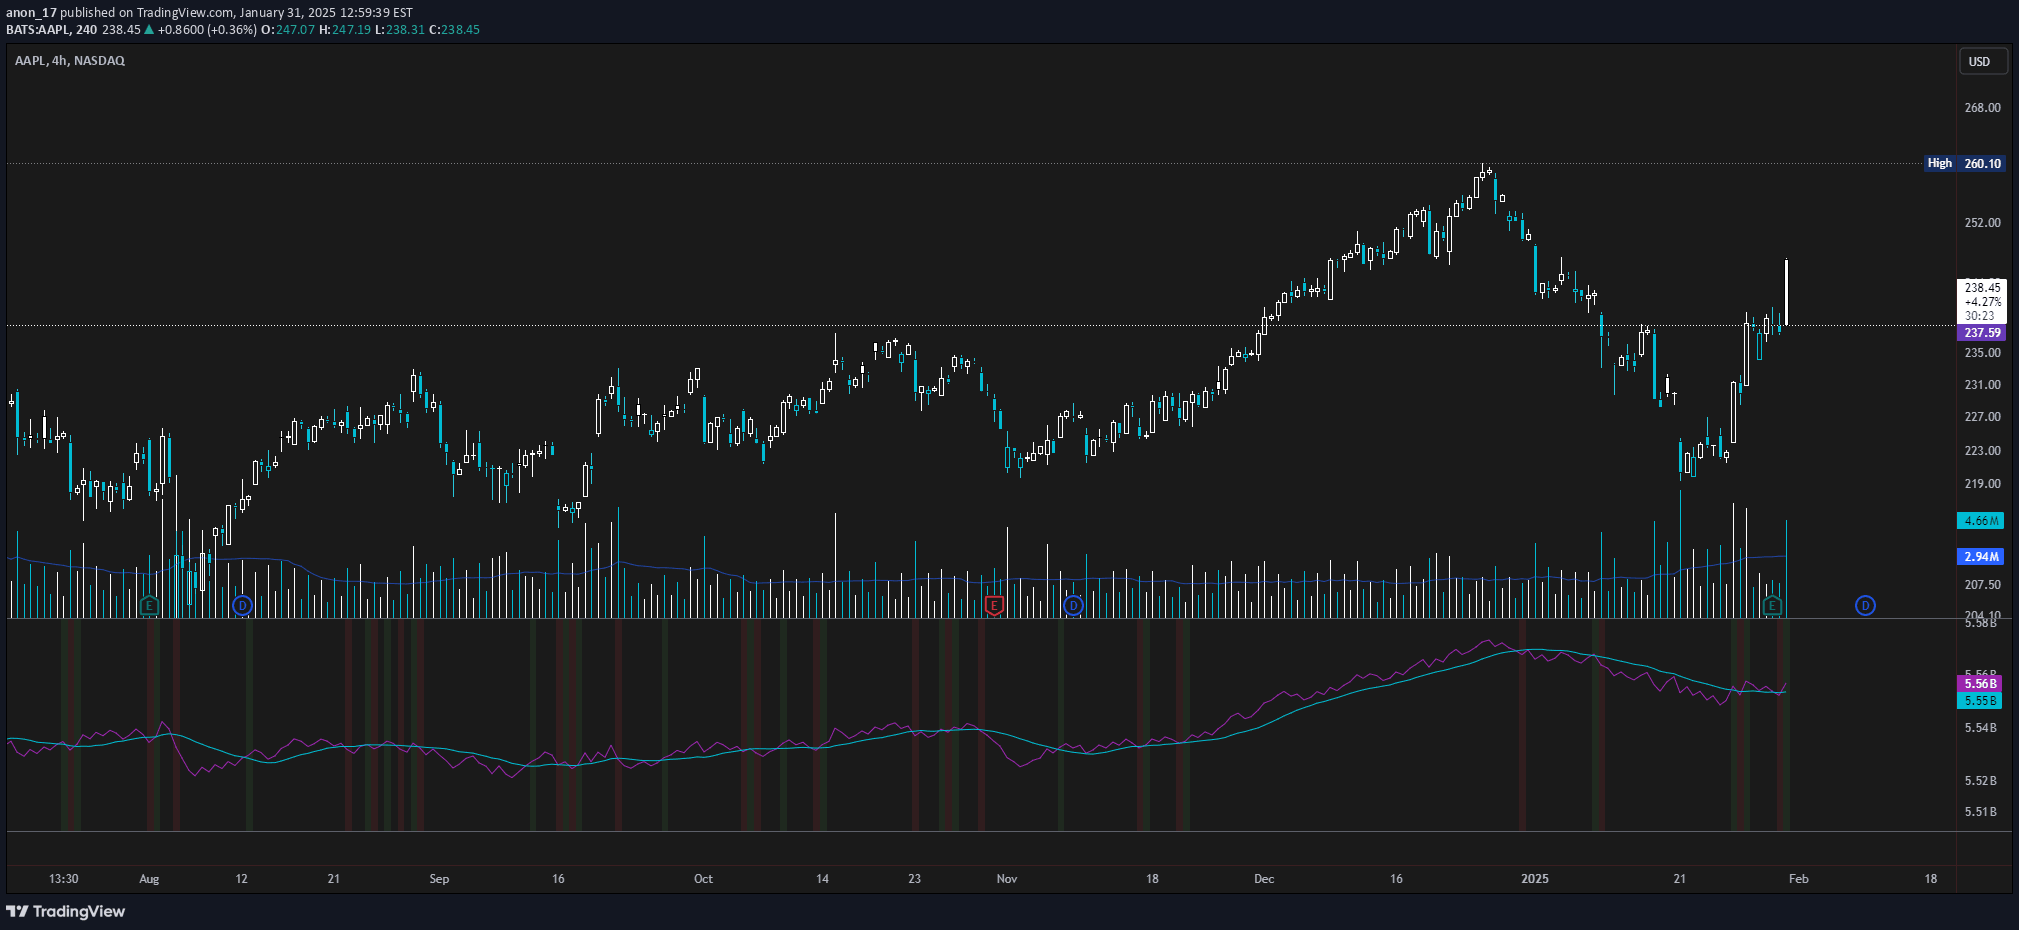
An enhanced On Balance Volume (OBV) indicator that highlights crossovers with its smoothed moving average, providing visual signals for potential trading opportunities.
Explore complementary indicator rolesHow it works
The indicator starts by calculating the On Balance Volume (OBV), which is a cumulative volume-based indicator that tracks buying and selling pressure. It then applies a smoothed moving average to the OBV, creating a trend line that helps identify the underlying volume momentum. The script uses different moving average types like SMA, EMA, RMA, WMA, or VWMA, allowing traders to customize the smoothing method.
When the OBV crosses above or below its smoothed moving average, the script triggers visual signals by changing the chart's background color. A green background indicates a bullish crossover, suggesting increased buying pressure, while a red background signals a bearish crossunder, implying potential selling pressure. This approach provides traders with a clear, intuitive method to interpret volume-based trend changes.
Why it may be useful
Volume is a critical indicator in technical analysis, offering insights into the strength and momentum of price movements. By combining OBV with a smoothed moving average, traders can gain a more nuanced understanding of market dynamics, distinguishing between genuine trend confirmations and potential false signals. The visual color-coding makes it easier to quickly interpret complex volume data, reducing the cognitive load of manual analysis.
The customizable nature of the indicator allows traders to adapt it to different market conditions and personal trading styles. By offering multiple moving average types and adjustable lengths, the script provides flexibility in analyzing volume trends across various timeframes and asset classes. This adaptability makes it a valuable tool for traders seeking to incorporate volume analysis into their trading strategies.
When to explore it
This indicator is most effective in markets with significant volume fluctuations, such as stocks, cryptocurrencies, and forex. It works best when used in conjunction with other technical indicators to confirm signals and provide additional context. Traders can benefit from its insights during trending markets, where volume confirmations can help validate the strength of a price movement.
The OBV crossover indicator is particularly useful during key market events, earnings releases, or periods of high market volatility. Traders should pay special attention to color changes that coincide with significant price action or when the indicator suggests a potential trend reversal. By combining this volume-based signal with price patterns, support and resistance levels, and other technical tools, traders can develop more robust and comprehensive trading strategies.
Keep exploring
What we’ve verified
Access, alerts and repainting behaviour have not been independently verified for this indicator. Check the creator’s current publication and settings.
General descriptions and classifications are recovered research. Verified details above identify the specific checks we have completed. Check the creator’s current publication for later changes.