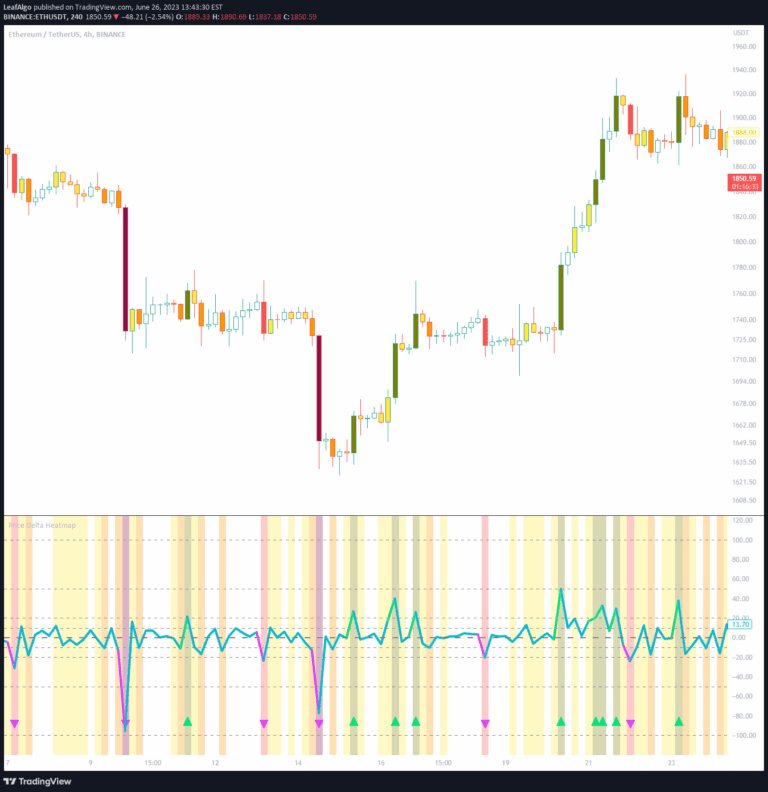
Open Price on Selected Timeframe is a dynamic indicator that displays the open price across multiple timeframes, using color changes to visually represent price trend movements.
Explore complementary indicator rolesHow it works
The Open Price indicator tracks the open price of candles across different timeframes like M1 to D1. It plots a horizontal line representing the open price and dynamically changes color based on price movement. When the current candle's open price is higher than the previous candle's, the line turns green, signaling an uptrend.
Conversely, when the current candle's open price is lower, the line turns red, indicating a potential downtrend. Traders can easily select their preferred timeframe through a user-friendly dropdown menu. The indicator provides a visual representation of price trends without requiring complex code modifications
Why it may be useful
This indicator helps traders quickly understand market trends and price dynamics across multiple timeframes. By providing a color-coded visual representation of open price movements, it simplifies technical analysis and trend identification. Traders can easily distinguish between bullish and bearish price actions at a glance.
The dynamic color changes offer immediate insights into market sentiment and potential trend reversals. It serves as a valuable tool for both novice and experienced traders seeking to make more informed trading decisions. The indicator's flexibility in timeframe selection makes it adaptable to various trading strategies
When to explore it
The Open Price indicator is most effective during periods of market volatility and trend transitions. It works best when used in conjunction with other technical analysis tools to confirm trend directions. Traders can utilize this indicator during key market sessions like European and US trading hours.
It is particularly useful for day traders and swing traders looking to identify short-term and medium-term trend changes. The indicator can help traders make more informed entry and exit decisions by providing clear visual cues about price momentum. Combining this tool with volume and momentum indicators can enhance its predictive power
Keep exploring
What we’ve verified
Access, alerts and repainting behaviour have not been independently verified for this indicator. Check the creator’s current publication and settings.
General descriptions and classifications are recovered research. Verified details above identify the specific checks we have completed. Check the creator’s current publication for later changes.