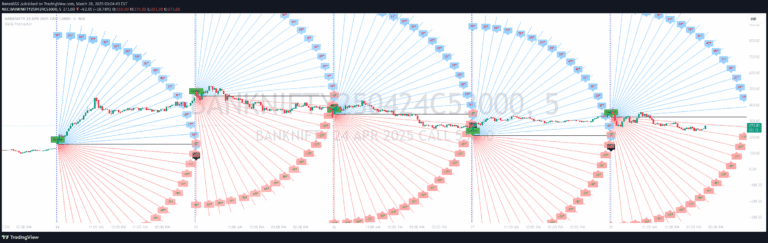
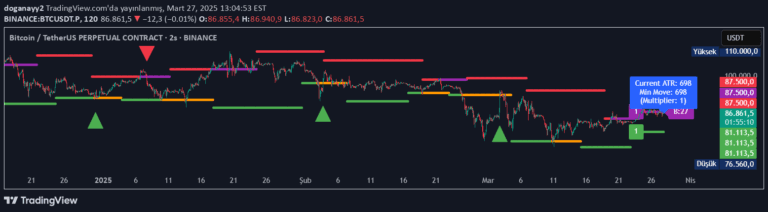
Opening Range Lines reveal the initial price range of a trading session, helping traders identify key support and resistance levels during early market hours.
Explore complementary indicator rolesHow it works
The Opening Range Lines indicator tracks the highest and lowest prices within a specified timeframe at the beginning of a trading session. Traders set a custom duration, typically within the first few minutes of trading, to capture the initial price range. The indicator then plots two distinct lines on the chart: a green line representing the highest price and a red line representing the lowest price during that period.
These lines serve as dynamic reference points for subsequent price action. When prices move beyond these initial range lines, it can signal potential trading opportunities, such as breakouts or breakdowns. Traders use these lines to understand market sentiment and potential price momentum in the early stages of a trading session.
Why it may be useful
The Opening Range Lines provide traders with a quick and visual method to understand early market dynamics and potential price movements. By capturing the initial price range, traders can gain insights into market sentiment, volatility, and potential directional bias for the trading day. These lines help traders make more informed decisions about entry and exit points, risk management, and overall trading strategy.
Moreover, the indicator offers a simple yet powerful tool for identifying potential support and resistance levels. Traders can use these lines to confirm other technical signals, validate trading strategies, and develop more precise entry and exit points. The color-coded visualization makes it easy to quickly interpret market conditions and potential trading opportunities.
When to explore it
The Opening Range Lines are most effective for intraday traders, particularly those focusing on short-term price movements and day trading strategies. They work best in liquid markets with significant early morning trading activity, such as major stock indices, popular stocks, and ETFs. Traders should use this indicator during the first few minutes of a trading session to capture the most relevant price range.
The indicator is particularly useful in volatile markets or during periods of significant economic announcements. Traders can adapt the timeframe to suit different market conditions and trading styles, making it a flexible tool for various trading approaches. It is especially valuable for traders seeking to understand early market sentiment and potential price momentum.
Keep exploring
What we’ve verified
Access, alerts and repainting behaviour have not been independently verified for this indicator. Check the creator’s current publication and settings.
General descriptions and classifications are recovered research. Verified details above identify the specific checks we have completed. Check the creator’s current publication for later changes.