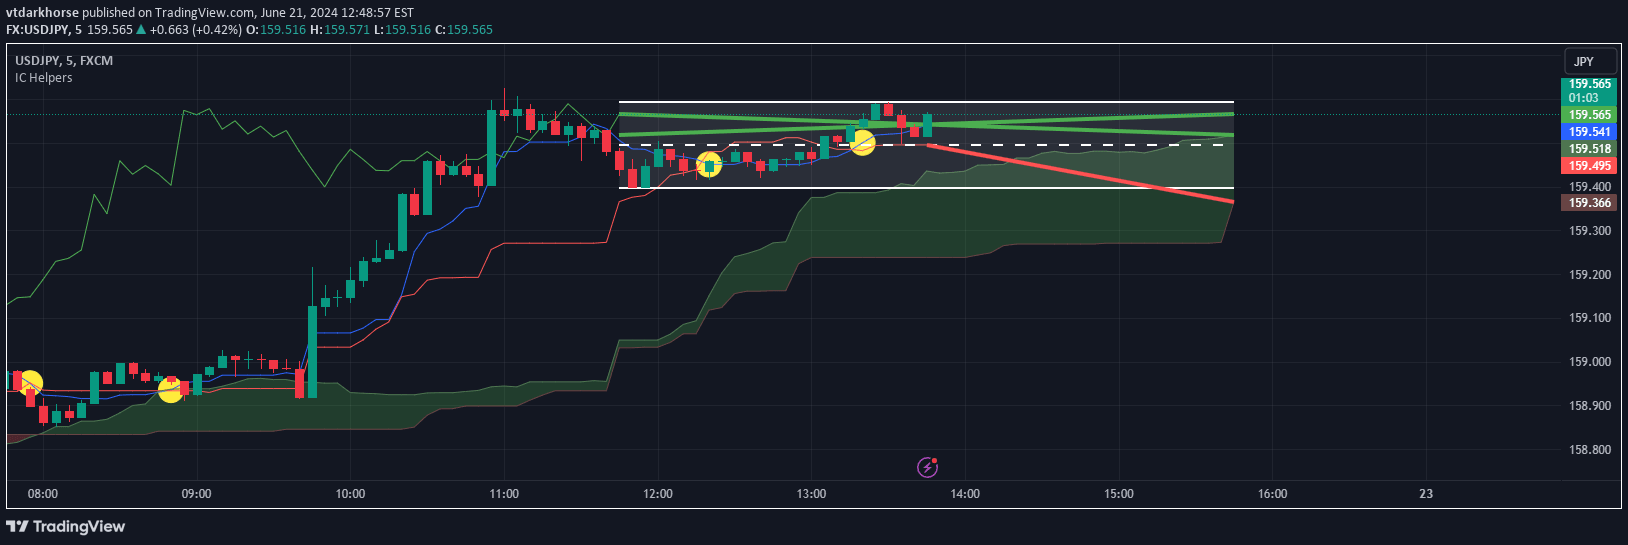
A hybrid trading system combining Ichimoku Cloud and HalfTrend to identify market trends, reversals, and potential entry/exit points using advanced technical analysis techniques.
Explore complementary indicator rolesHow it works
The indicator integrates two powerful technical analysis methods: Ichimoku Cloud and HalfTrend. The Ichimoku Cloud uses multiple lines and a cloud formation to determine trend direction, support, and resistance levels by analyzing price relationships across different time periods. HalfTrend complements this by detecting trend reversals based on high and low price deviations from a moving average.
The system calculates trend direction by comparing conversion and base lines, while also tracking price movements relative to the HalfTrend line. It generates visual signals like colored candles and directional arrows to help traders quickly understand market conditions and potential trading opportunities.
Why it may be useful
This hybrid indicator provides traders with a comprehensive view of market dynamics by combining trend identification and reversal detection. By integrating multiple technical analysis techniques, it offers more robust and nuanced insights than single-indicator approaches, reducing the likelihood of false signals and improving trade decision-making.
The visual representation through custom candle colors, trend lines, and directional arrows makes complex market analysis more accessible and intuitive. Traders can quickly interpret market conditions, identify potential entry and exit points, and make more informed trading decisions across different timeframes and market environments.
When to explore it
The Ichimoku Cloud and HalfTrend hybrid system works best in trending markets with clear directional movement, such as during strong bullish or bearish cycles. It is particularly effective in liquid markets with sufficient price volatility, including forex, stocks, and cryptocurrency trading environments where price movements are more predictable.
Traders should apply this indicator across multiple timeframes to confirm signals and reduce false positives. It is most valuable when combined with additional confirmation tools like volume analysis or other momentum indicators, helping to validate the generated trading signals and improve overall trading strategy reliability.
Keep exploring
What we’ve verified
Access, alerts and repainting behaviour have not been independently verified for this indicator. Check the creator’s current publication and settings.
General descriptions and classifications are recovered research. Verified details above identify the specific checks we have completed. Check the creator’s current publication for later changes.