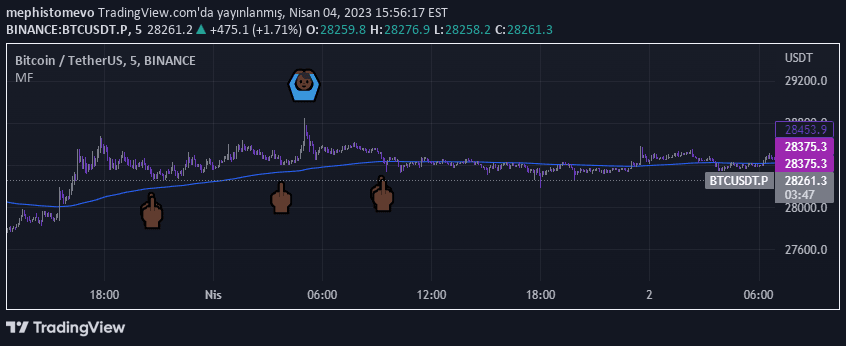
A custom fear and greed oscillator using Heikin-Ashi candles to measure market sentiment, providing dynamic visual insights into bullish and bearish momentum.
Explore complementary indicator rolesHow it works
The indicator calculates a custom oscillator using Heikin-Ashi candles, centering the value at 50 to represent market sentiment. It analyzes candle body size, range, and a proprietary 'candle strength' metric to generate the oscillator value. Values above 50 suggest bullish sentiment (greed), while values below 50 indicate bearish sentiment (fear).
The oscillator features dynamic gradient coloring that transitions from blue (fear) to pink (greed), providing an intuitive visual representation of market conditions. Additionally, it calculates percentage changes in Heikin-Ashi close every 5 bars, allowing traders to quickly identify rapid market movements and potential sentiment shifts.
Why it may be useful
Traditional market analysis often relies on lagging indicators that fail to capture real-time sentiment nuances. This custom oscillator provides a unique, forward-looking perspective by integrating multiple market dynamics into a single, visually compelling indicator. By blending candle characteristics and momentum analysis, traders can gain deeper insights into potential trend reversals and market psychology.
The indicator's innovative approach allows traders to quickly assess market sentiment without complex interpretation. Its gradient coloring and fast movement metrics offer an intuitive way to understand market dynamics, helping traders make more informed decisions about potential entry and exit points.
When to explore it
This oscillator is most effective in markets with clear directional movements and moderate to high volatility. It works particularly well for short-term trading strategies, such as scalping and day trading, where rapid sentiment shifts can provide actionable trading opportunities. Traders should focus on its signals during periods of significant price action and when combined with other technical analysis tools.
The indicator is especially useful when markets show uncertain or transitional behavior, helping traders identify potential trend changes before they become apparent through traditional methods. However, it should not be used in isolation, and traders are advised to integrate its insights with comprehensive market analysis, risk management strategies, and additional confirmation signals.
Keep exploring
What we’ve verified
Access, alerts and repainting behaviour have not been independently verified for this indicator. Check the creator’s current publication and settings.
General descriptions and classifications are recovered research. Verified details above identify the specific checks we have completed. Check the creator’s current publication for later changes.