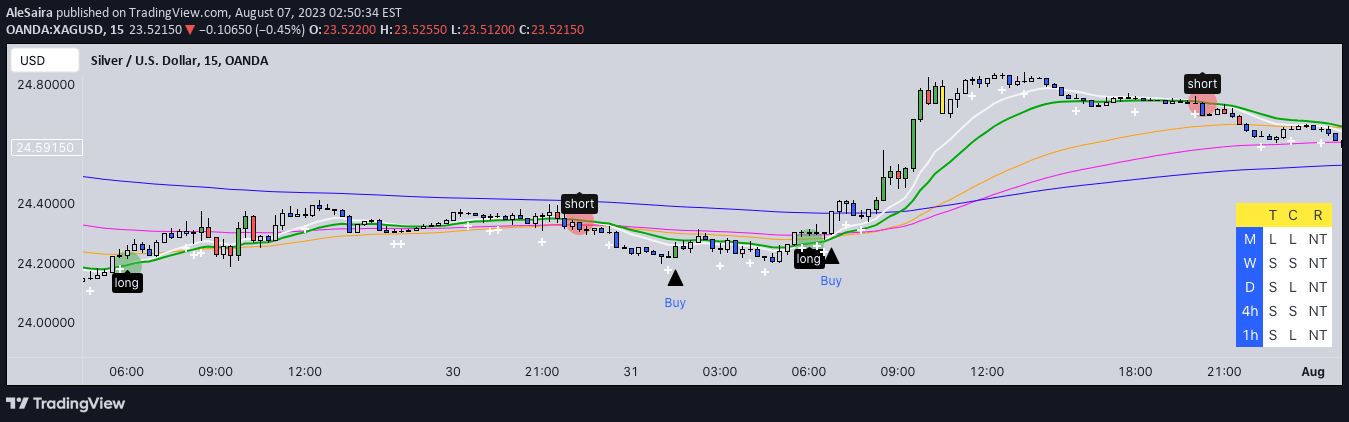
A Bitcoin trading signal using the 5-period Exponential Moving Average to generate buy and sell indicators based on price movements relative to the EMA line.
Explore complementary indicator rolesHow it works
The Panic Drop BTC 5 EMA indicator tracks Bitcoin's price movement in relation to a 5-period Exponential Moving Average (EMA). When the price closes above the EMA, a green buy arrow appears below the candle, signaling a potential bullish momentum. Conversely, when the price closes below the EMA, a red sell arrow appears above the candle, indicating a potential bearish momentum shift.
The indicator offers customizable settings, allowing traders to adjust the EMA period, timeframe, and visual elements. Traders can modify the line color, toggle signal visibility, and set up alerts for buy and sell triggers across various timeframes like daily or hourly charts.
Why it may be useful
This indicator simplifies trading decisions by providing clear, visual signals for Bitcoin price movements. It helps traders quickly identify momentum shifts without requiring complex technical analysis, making it especially useful for beginners and time-constrained investors. The straightforward arrow system allows traders to make faster, more intuitive trading choices.
By tracking the 5-period EMA, the indicator captures rapid price changes characteristic of cryptocurrency markets. It offers a streamlined approach to understanding Bitcoin's short-term trends, enabling traders to potentially catch dips, exits, and momentum changes with greater ease and confidence.
When to explore it
The Panic Drop BTC 5 EMA is most effective when trading Bitcoin on shorter timeframes like daily or hourly charts. It works best in markets with clear trending behavior, where price movements consistently respect the EMA line. Traders should use this indicator in conjunction with other technical analysis tools to confirm signals and reduce false positives.
This signal is particularly useful during periods of market volatility, where quick momentum shifts are common. It can help traders identify potential entry and exit points, especially when Bitcoin is experiencing significant price fluctuations. Traders should combine these signals with risk management strategies and their overall trading plan.
Keep exploring
What we’ve verified
Access, alerts and repainting behaviour have not been independently verified for this indicator. Check the creator’s current publication and settings.
General descriptions and classifications are recovered research. Verified details above identify the specific checks we have completed. Check the creator’s current publication for later changes.