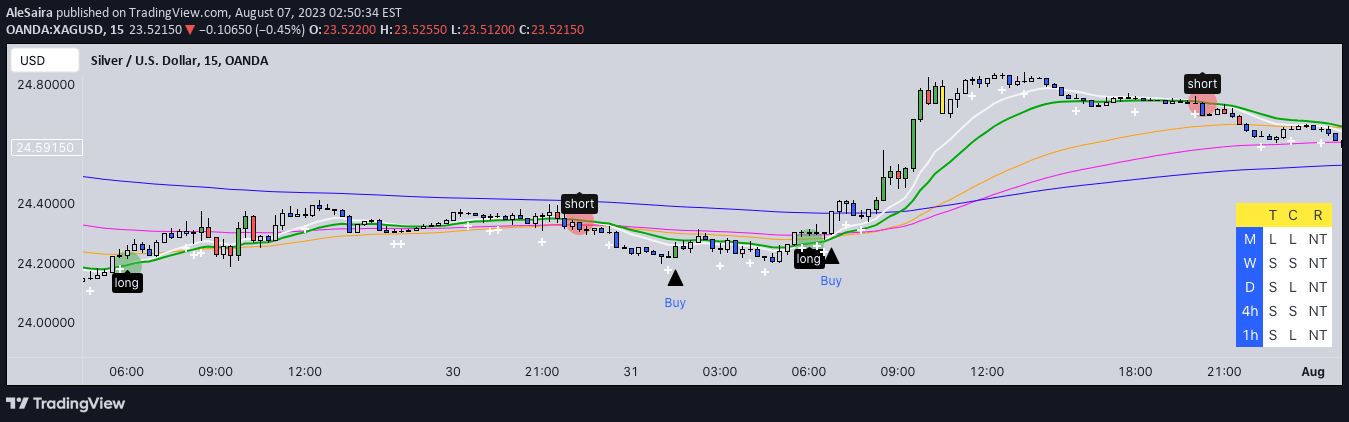
A trading strategy using multiple exponential moving averages to generate buy and sell signals with trend confirmation and volatility filtering.
Explore complementary indicator rolesHow it works
The signal generates buy and sell signals by analyzing the crossover of multiple exponential moving averages (EMAs) with different time periods. It focuses on the interaction between the 13-period, 50-period, and 200-period EMAs to identify potential market trend changes and entry points.
The strategy incorporates additional filtering mechanisms like trend direction analysis and normalized Average True Range (ATR) to reduce false signals. By requiring the 200-period EMA to be in an uptrend and the normalized ATR to be below a specific threshold, the signal aims to improve trade accuracy and filter out choppy market conditions.
Why it may be useful
This trading signal provides traders with a systematic approach to identifying potential market entry and exit points by combining multiple technical analysis techniques. By using multiple EMAs, traders can gain insights into short-term and long-term market trends, helping them make more informed trading decisions.
The incorporation of trend and volatility filters helps reduce the likelihood of entering trades during uncertain market conditions. This approach can help traders minimize false signals and improve overall trading strategy effectiveness by providing a more comprehensive view of market dynamics.
When to explore it
The signal works best in markets with clear trending conditions, particularly in assets that demonstrate consistent momentum and directional movement. It is most effective in timeframes that allow sufficient time for the moving averages to interact and generate meaningful signals, such as daily and weekly charts.
Traders should consider using this signal in markets with moderate volatility, where price movements are smooth and predictable. It is particularly useful in liquid markets like major stock indices, forex pairs, and heavily traded commodities where price trends are more likely to develop and sustain.
Keep exploring
What we’ve verified
Access, alerts and repainting behaviour have not been independently verified for this indicator. Check the creator’s current publication and settings.
General descriptions and classifications are recovered research. Verified details above identify the specific checks we have completed. Check the creator’s current publication for later changes.