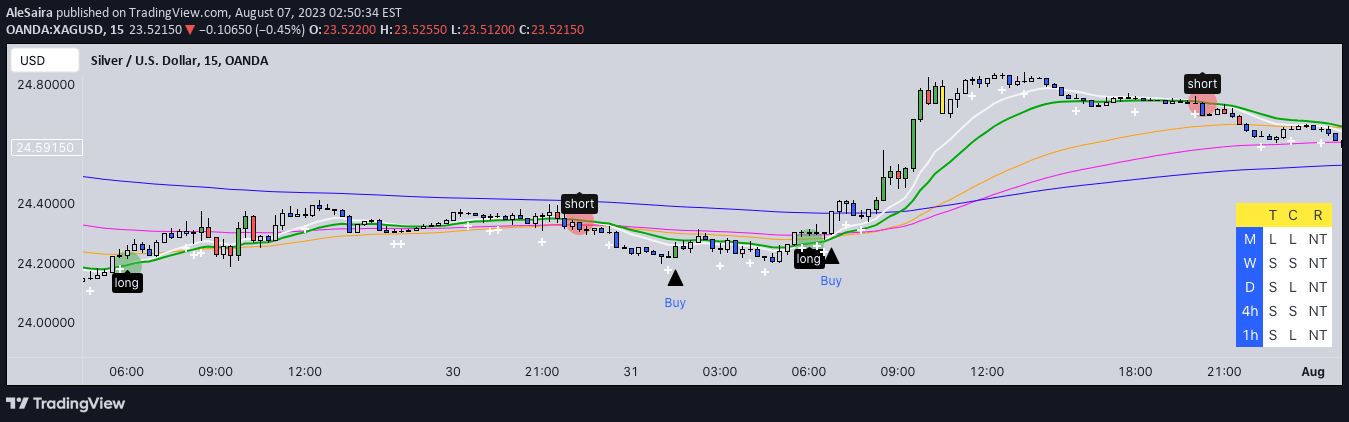
A trading signal that uses EMA, MACD, and RSI to identify market trends and generate buy/sell signals with customizable parameters and visual chart indicators.
Explore complementary indicator rolesHow it works
This trading signal operates by integrating multiple technical indicators to generate precise market entry and exit points. The Exponential Moving Average (EMA) serves as the primary trend filter, determining the overall market direction by comparing current price to the EMA line.
The signal further incorporates MACD and RSI to confirm trend strength and momentum, providing additional validation for potential trades. When price crosses above the EMA and momentum indicators align, a buy signal is generated, while crossing below triggers a potential sell signal.
Why it may be useful
Technical trading signals like this provide traders with structured, systematic approaches to market analysis that reduce emotional decision-making. By combining multiple indicators, the signal offers a more comprehensive view of market conditions, increasing the probability of successful trades.
The customizable nature of this signal allows traders to adapt the strategy to different market environments and personal risk tolerances. It transforms complex technical analysis into actionable insights, helping traders make more informed and disciplined investment decisions.
When to explore it
This trading signal is most effective in markets with clear trending characteristics, where price movements are more predictable and directional. It performs optimally in liquid markets with consistent price momentum, such as major forex pairs, large-cap stocks, and prominent cryptocurrency pairs.
Traders should be cautious during periods of high market volatility or sideways consolidation, as the signal's effectiveness can diminish when clear trends are absent. It is particularly suited for shorter timeframes like 5-minute to 1-hour charts, making it ideal for active traders seeking timely market entry points.
Keep exploring
What we’ve verified
Access, alerts and repainting behaviour have not been independently verified for this indicator. Check the creator’s current publication and settings.
General descriptions and classifications are recovered research. Verified details above identify the specific checks we have completed. Check the creator’s current publication for later changes.