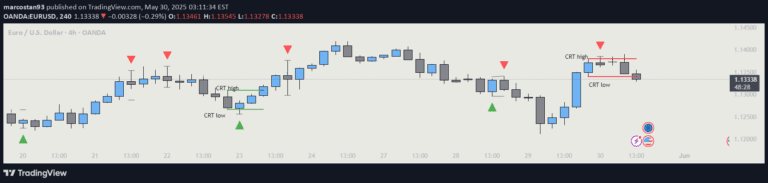
Candle Range Trading (CRT) with Alerts
A trading indicator that identifies potential market reversals or continuations by analyzing two consecutive candle patterns and generating visual signals with triangular markers.
Explore 11,183 indicators. Filter beyond the obvious.
Discover the tools that fit the way you trade.
11,183 tools to explore
A trading indicator that identifies potential market reversals or continuations by analyzing two consecutive candle patterns and generating visual signals with triangular markers.
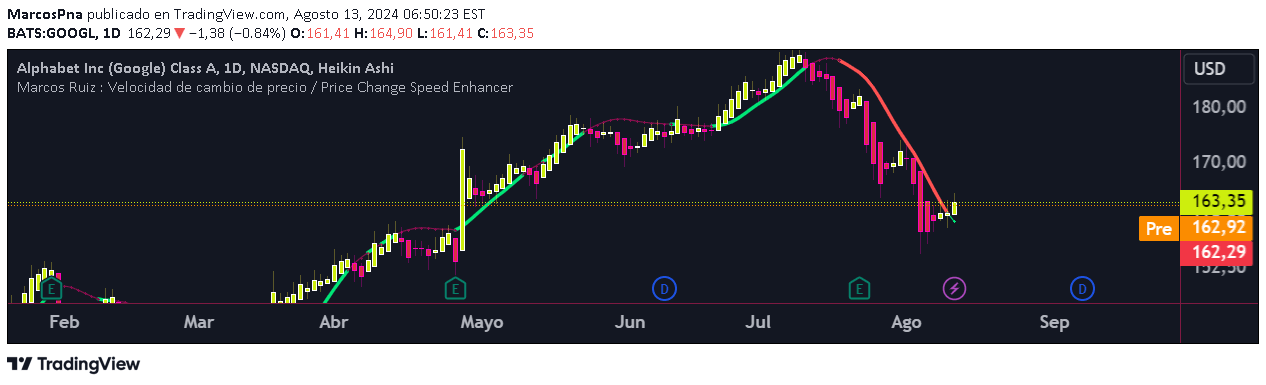
A dynamic Pine Script indicator that analyzes price change speed using customizable moving averages and price sources, providing visual insights into price momentum and trend strength.
A minimalistic trading indicator designed to help traders visualize and track specific market sessions and time zones with customizable color schemes and automatic timezone handling.
A trading signal that uses EMA, MACD, and RSI to identify market trends and generate buy/sell signals with customizable parameters and visual chart indicators.
A script tracking Federal Reserve interest rates through ZQ futures contracts, providing real-time insights into current and upcoming monetary policy indicators for traders.
A technical indicator measuring currency strength using Rate of Change (ROC) and moving averages to analyze relative currency performance and market dynamics.
A weekly stock performance comparison strategy that helps identify potential investment opportunities by measuring a stock's performance relative to its sector benchmark.
An advanced momentum indicator using Principal Component Analysis to assess market trend strength and structural stability by decomposing price data into fundamental patterns.
Likes, views, and comments are historical TradingView snapshots. They describe attention, not trading performance.