A trading signal that measures daily price movement by aggregating the path of travel for a Relative Strength Volume Adjusted EMA, revealing actual price action beyond traditional OHLC measurements.
Explore complementary indicator rolesHow it works
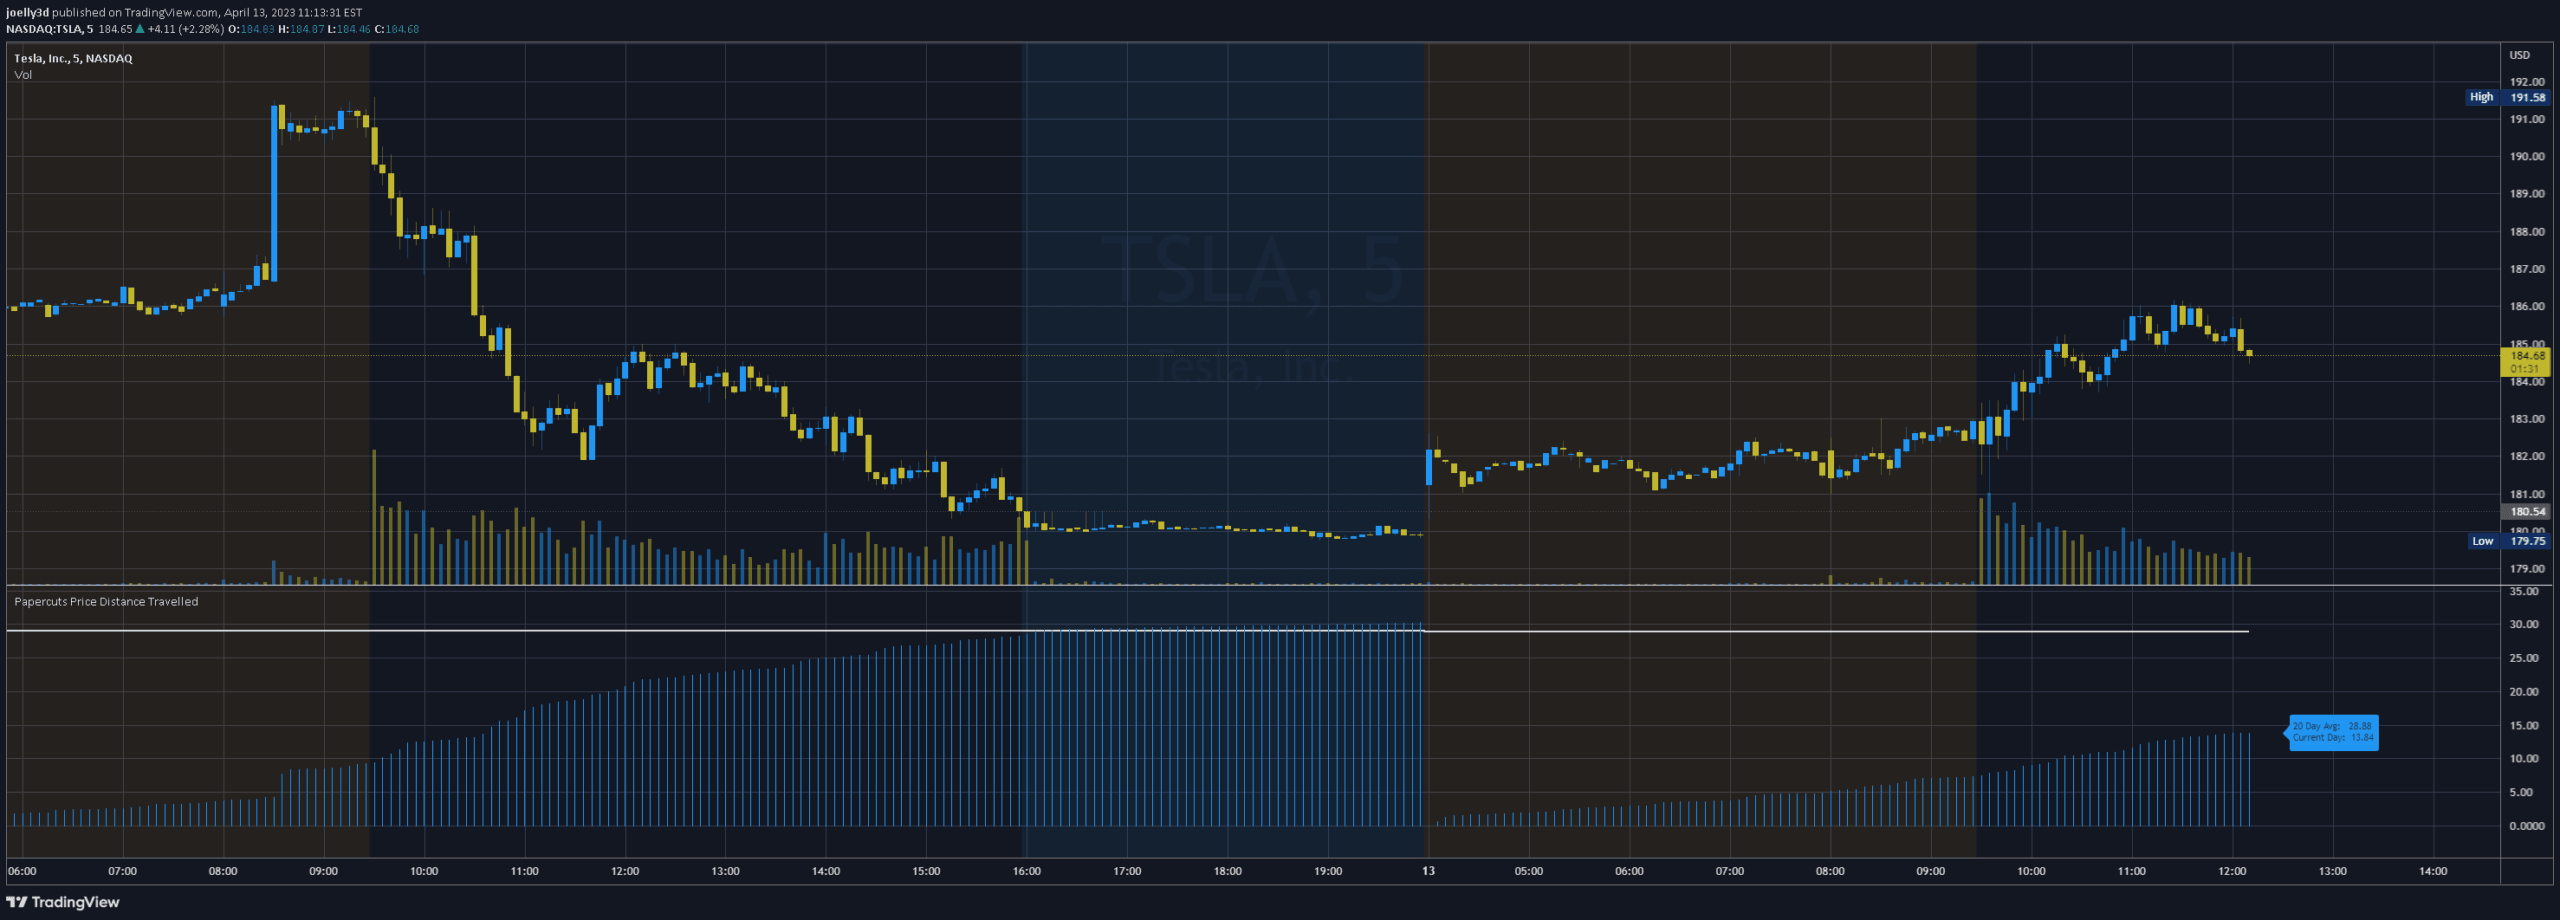
The Papercuts Price Distance Travelled signal calculates price movement by tracking an RSVAEMA (Relative Strength Volume Adjusted EMA) and capturing its absolute path of travel. It aggregates this movement throughout the trading day, effectively 'unpleating' the price action to reveal more nuanced price dynamics beyond traditional daily range measurements.
By resetting the measurement daily and tracking peak movements, the signal creates an array of daily price travel distances. This approach allows traders to understand the true extent of price movement, differentiating between perceived and actual price volatility across different timeframes and instrument characteristics.
Why it may be useful
Traditional market analysis often relies on standard measurements like Daily Average True Range (ATR), which can obscure the true complexity of price movement. This signal provides traders with a more granular view of price action, revealing how much an asset actually moves during a trading session beyond simple open, high, low, and close values.
By offering insights into real price travel, traders can develop more sophisticated understanding of market dynamics, potential entry and exit points, and the actual volatility of different instruments. This approach helps traders distinguish between seemingly extreme moves and statistically normal price behavior.
When to explore it
The Papercuts Price Distance Travelled signal is most effective for short-term trading strategies, particularly for instruments with high intraday volatility. It works best when applied to actively traded stocks, futures, or forex pairs that demonstrate significant price movement within a single trading session.
Traders should consider using this signal when seeking to understand the true range of price action, especially for assets like TSLA that can show dramatically different movement characteristics across varying timeframes. It is particularly useful for scalpers and day traders who need precise insights into actual price travel and potential profit opportunities.
Keep exploring
What we’ve verified
Access, alerts and repainting behaviour have not been independently verified for this indicator. Check the creator’s current publication and settings.
General descriptions and classifications are recovered research. Verified details above identify the specific checks we have completed. Check the creator’s current publication for later changes.