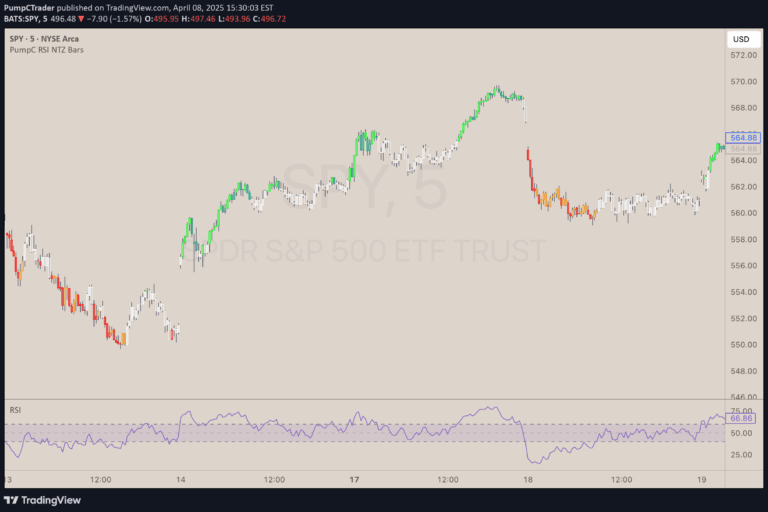
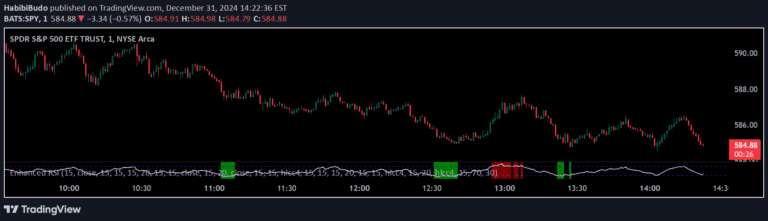
A custom RSI indicator comparing a stock's momentum to the Nasdaq, providing insights into relative strength and market performance across different timeframes.
Explore complementary indicator rolesHow it works
The script calculates the Relative Strength Index (RSI) for both a selected stock and the Nasdaq index using a standard 14-period timeframe. It uses the standard RSI formula of comparing average gains to average losses over the specified period, generating a value between 0 and 100 that indicates momentum.
By plotting both RSIs simultaneously, traders can visually compare the stock's performance against the broader market index. The stock's RSI appears in green, while the Nasdaq's RSI is displayed in red, creating an easy-to-interpret comparative visualization that highlights relative strength and market dynamics.
Why it may be useful
Comparing a stock's RSI to the Nasdaq provides critical context about market performance and individual stock momentum. This approach helps traders understand whether a stock is moving in sync with broader market trends or diverging, which can signal potential investment opportunities or risks.
The comparative RSI allows traders to assess relative strength more comprehensively, moving beyond simple individual stock analysis. By simultaneously tracking both the stock and market RSIs, investors can make more informed decisions about entry and exit points, potential trend reversals, and overall market sentiment.
When to explore it
This RSI comparison method works best during periods of market volatility or when seeking to understand a stock's performance relative to broader market trends. Traders can use it most effectively during trending markets where clear momentum differences between a stock and the index become more apparent.
The indicator is particularly useful when analyzing stocks within sectors that typically correlate closely with overall market performance. It provides enhanced insights during earnings seasons, major economic announcements, or when evaluating stocks that might be experiencing unique fundamental or technical circumstances.
Keep exploring
What we’ve verified
Access, alerts and repainting behaviour have not been independently verified for this indicator. Check the creator’s current publication and settings.
General descriptions and classifications are recovered research. Verified details above identify the specific checks we have completed. Check the creator’s current publication for later changes.