
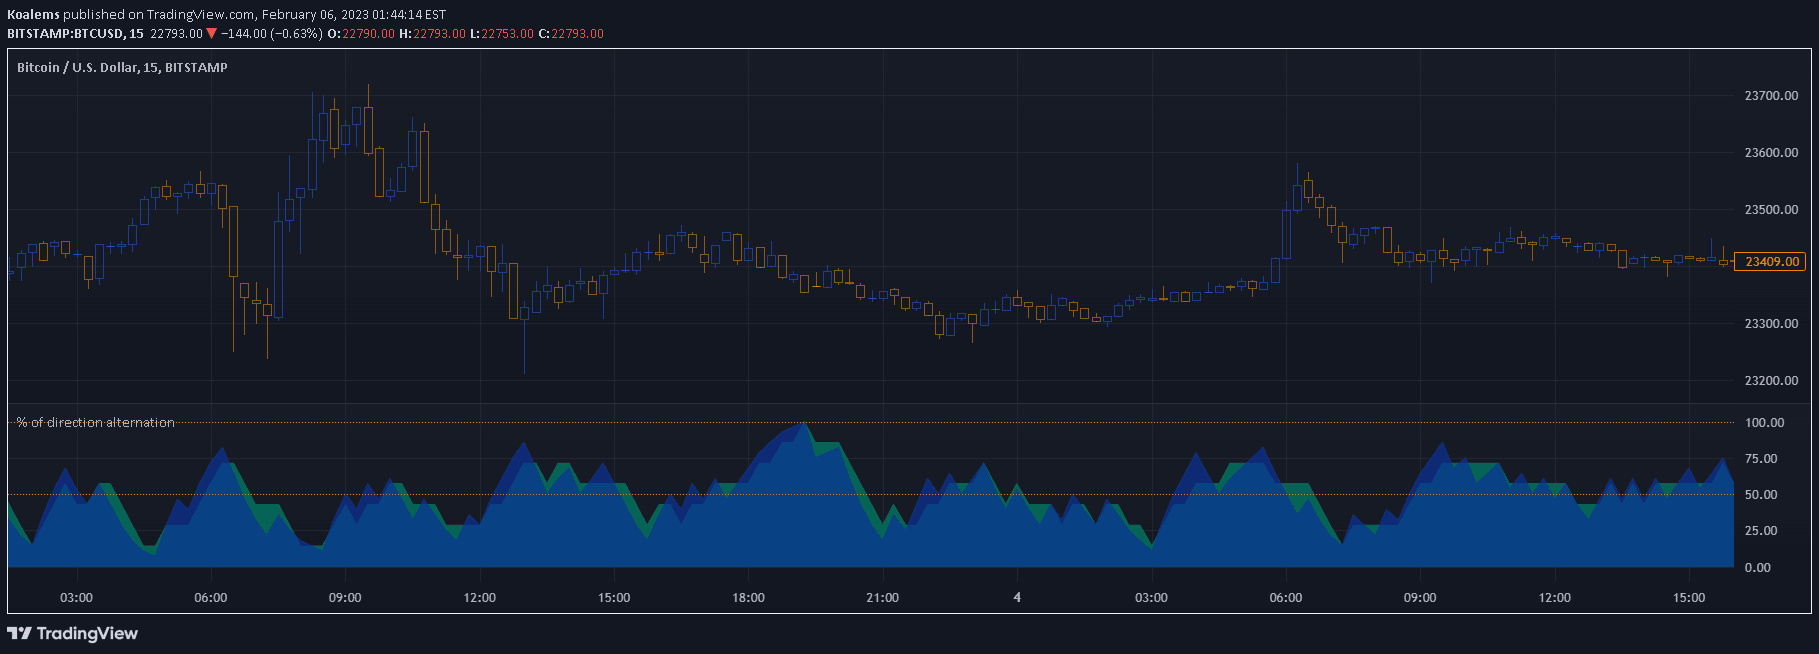
A trading signal that measures price bar alternation to identify ranging markets and potential trend shifts by analyzing consecutive candle close relationships over a specified number of bars.
Explore complementary indicator rolesHow it works
The signal examines a configurable number of historical price bars and compares their closing prices relative to their opening prices. It tracks how often consecutive bars alternate between bullish (close higher than open) and bearish (close lower than open) conditions.
By calculating the percentage of alternations across the selected bar range, the indicator generates an 'alternation percentage' and a 'weighted alternation percentage'. These metrics provide insights into market behavior, with higher alternation percentages suggesting increased market choppiness or ranging conditions.
Why it may be useful
The alternation signal helps traders understand market dynamics by revealing periods of indecision and potential trend transitions. By quantifying the relationship between consecutive price bars, traders can gain insights into market sentiment and potential trading opportunities.
The weighted alternation percentage offers additional nuance by giving more significance to recent price action, which can help identify emerging market conditions and potential trend reversals more effectively than traditional static indicators.
When to explore it
The alternation signal is most effective in markets experiencing range-bound or sideways price action. Traders can use high alternation percentages as a warning to avoid entering new trades or to consider exiting existing positions during choppy market conditions.
Conversely, the signal might also indicate potential trend initiation when alternation peaks, suggesting a possible transition from ranging to trending market behavior. Traders should combine this signal with other technical analysis tools to confirm potential trading signals.
Keep exploring
What we’ve verified
Access, alerts and repainting behaviour have not been independently verified for this indicator. Check the creator’s current publication and settings.
General descriptions and classifications are recovered research. Verified details above identify the specific checks we have completed. Check the creator’s current publication for later changes.


