
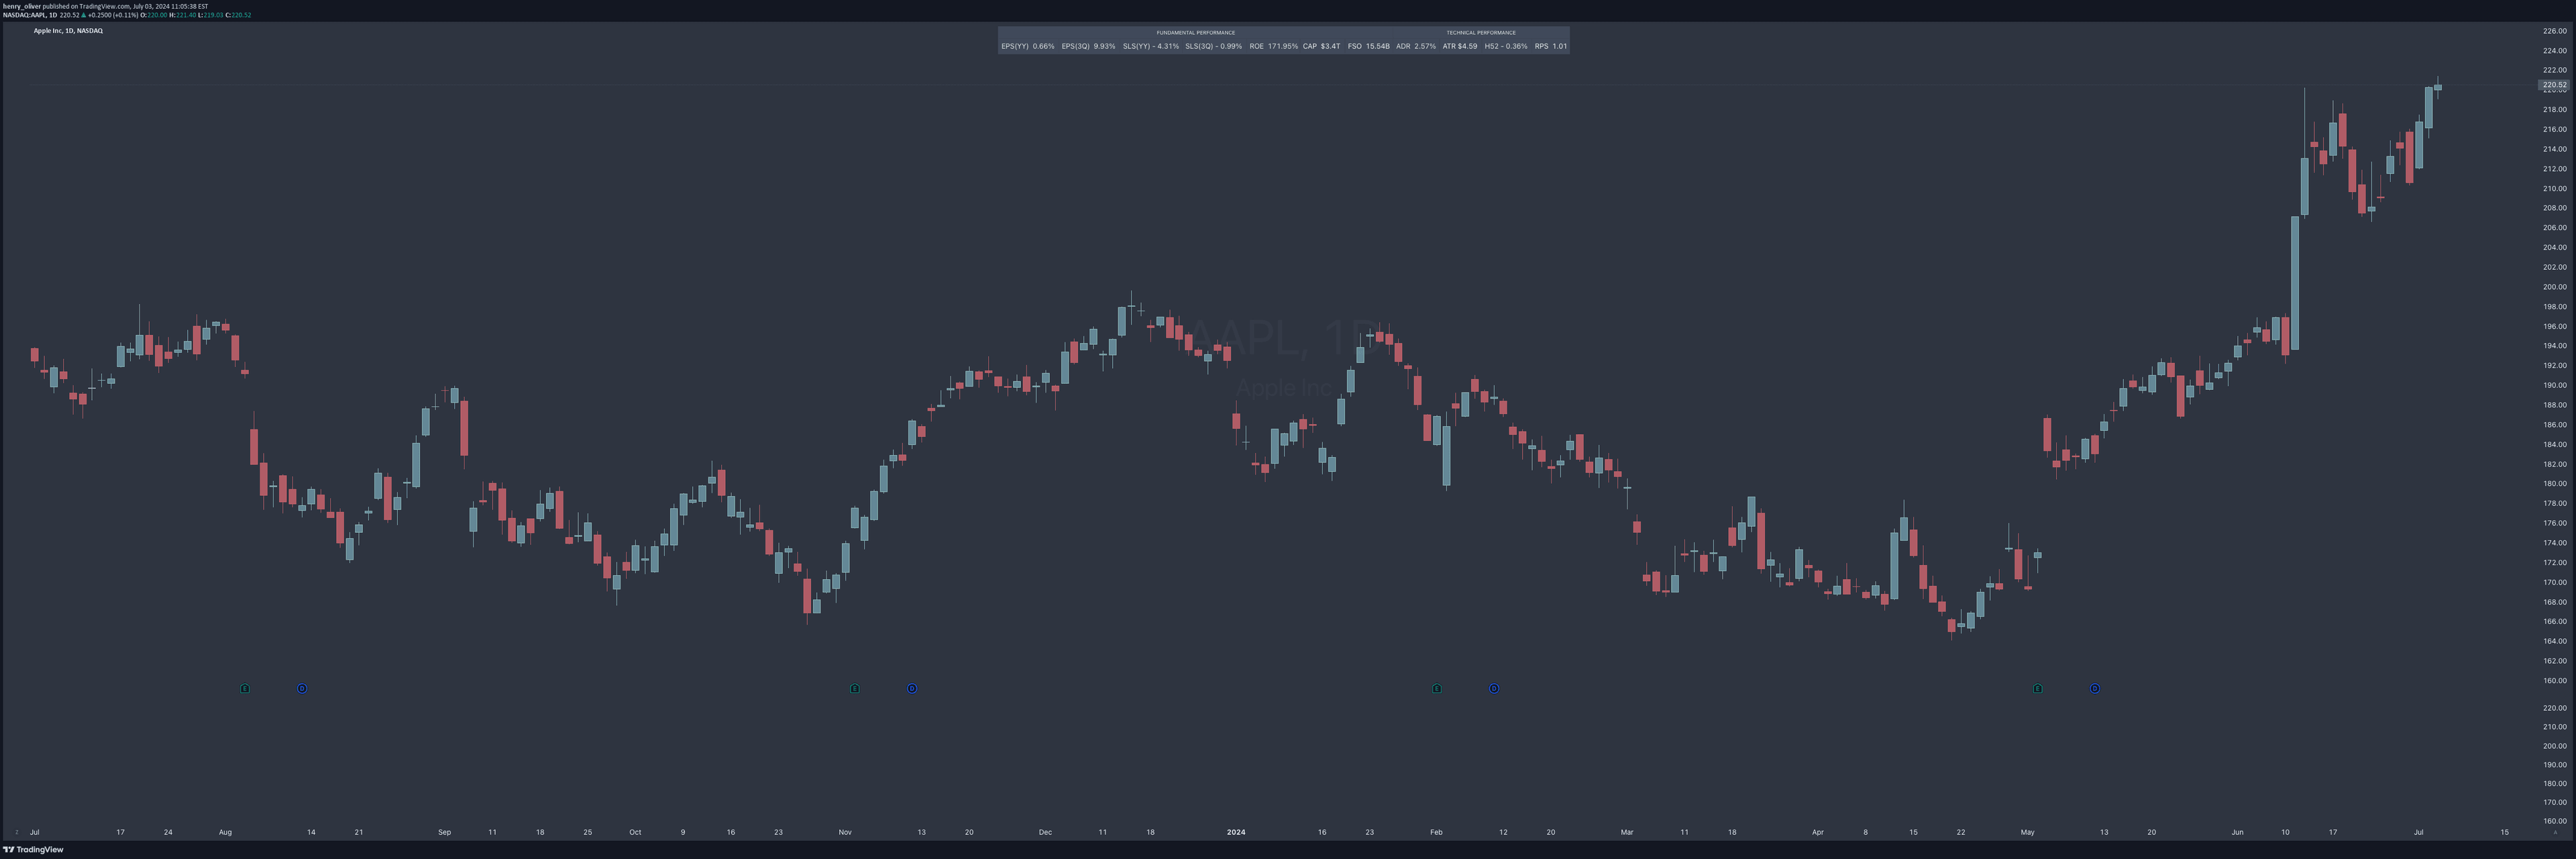
A comprehensive trading tool analyzing both fundamental financial metrics and technical market performance to provide traders with a holistic view of a security's potential and behavior.
Explore complementary indicator rolesHow it works
The Performance Indicators tool integrates two distinct analysis approaches: fundamental and technical performance metrics. Fundamental indicators examine key financial aspects like earnings per share (EPS), sales growth, return on equity, and market capitalization to assess a company's intrinsic financial health.
Technical performance indicators complement fundamental analysis by measuring market behavior through metrics like average daily range, volatility, price strength, and 52-week price performance. By combining these perspectives, traders gain a multi-dimensional understanding of a security's potential and current market dynamics.
Why it may be useful
Performance indicators provide traders with a comprehensive framework for evaluating investment opportunities beyond simplistic price analysis. By examining both fundamental financial metrics and technical market behavior, traders can make more informed and nuanced decisions about potential trades and long-term investments.
These indicators help traders understand not just the current market price, but the underlying financial strength and market sentiment driving a security's performance. This holistic approach reduces risk by offering insights into a company's growth trends, profitability, and market positioning.
When to explore it
Performance indicators are most effective when traders are seeking a comprehensive assessment of a security's potential before making investment decisions. They are particularly valuable during periods of market uncertainty or when evaluating new investment opportunities across different sectors and market conditions.
Traders should use these indicators when comparing multiple securities, assessing a company's financial health, or seeking to understand the broader context of a stock's performance. They are especially useful for investors who want to combine fundamental financial analysis with technical market insights.
Keep exploring
What we’ve verified
Access, alerts and repainting behaviour have not been independently verified for this indicator. Check the creator’s current publication and settings.
General descriptions and classifications are recovered research. Verified details above identify the specific checks we have completed. Check the creator’s current publication for later changes.


