Market sessions and Volume profile - By Leviathan
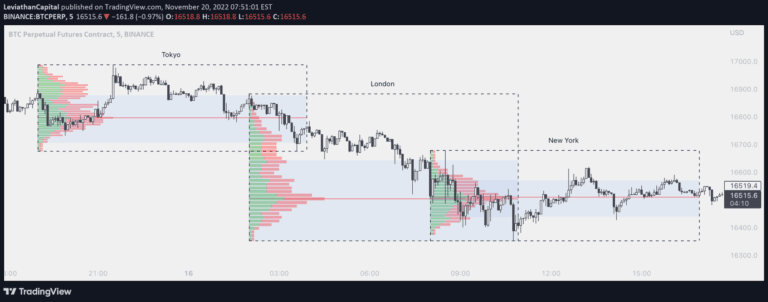
A comprehensive forex market session tracker with Volume Profile analysis that allows traders to visualize trading activity across different global market sessions and timeframes.
Explore 11,183 indicators. Filter beyond the obvious.
Discover the tools that fit the way you trade.
11,183 tools to explore
A comprehensive forex market session tracker with Volume Profile analysis that allows traders to visualize trading activity across different global market sessions and timeframes.
Advanced trading indicator providing comprehensive market structure analysis with customizable sensitivities, identifying price action patterns, order blocks, and session dynamics for strategic trading decisions.
A footprint bar indicator that visualizes volume or open interest data within the chart's visible range, offering three different heatmap styles to analyze trading activity.
A customizable market session tracker displaying trading hours for Tokyo, London, New York, and Sydney with multiple visualization options and advanced trading insights.
An advanced script that identifies and visualizes pivot points, helping traders recognize market structure, potential support/resistance levels, and trading opportunities through customizable swing high and low indicators.
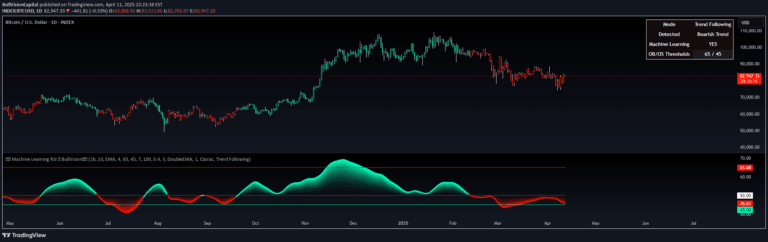
A sophisticated RSI indicator that uses machine learning and K-Nearest Neighbors to dynamically adapt momentum analysis by comparing current market conditions with historical patterns.
Volume Suite provides multiple volume-based indicators to analyze trading activity, including Volume Delta, CVD, Buy/Sell Volume, and Relative Volume for comprehensive market insights.
An advanced Open Interest indicator that provides comprehensive market insights through multiple visualization techniques and real-time statistical analysis of trading positions.
An advanced trading tool that analyzes price ranges by automatically drawing range levels, volume profiles, and various analytical tools to help traders understand market structure and potential price movements.
A comprehensive trading signal that identifies and visualizes price gaps, wicks, and market imbalances across multiple timeframes with advanced customization options.
An advanced Open Interest indicator that visualizes market positioning by tracking contract changes and aggregating trading activity across different price levels.
A multi-asset performance indicator that tracks percentage changes across 30 symbols, offering comprehensive insights into asset performance, correlation, and market dynamics.
Likes, views, and comments are historical TradingView snapshots. They describe attention, not trading performance.