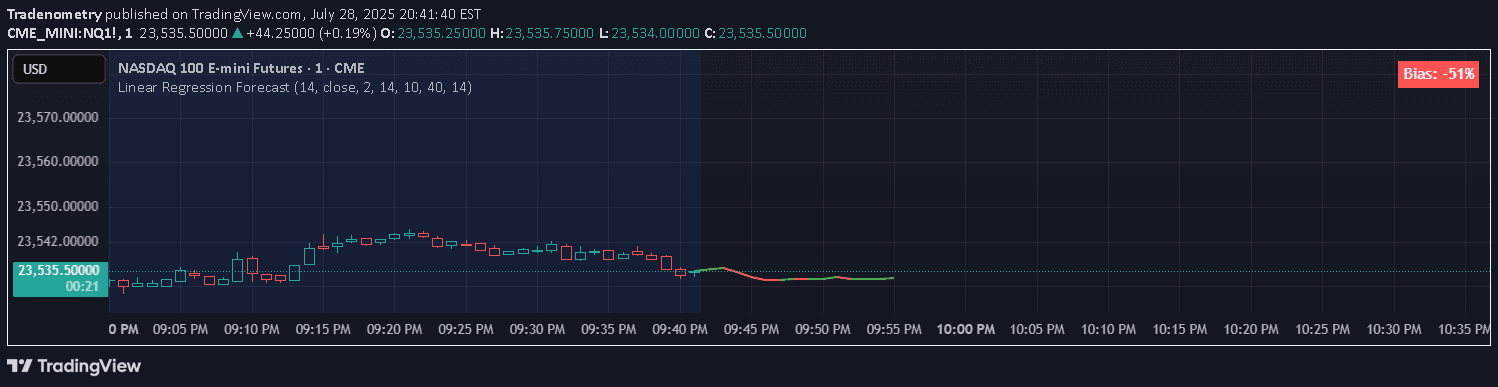
A price simplification algorithm that captures key turning points by reducing price movement to a limited number of significant anchors and connecting lines.
Explore complementary indicator rolesHow it works
The algorithm begins by selecting a lookback period of price data and creating an initial straight line connecting the oldest and newest price points. It then systematically identifies the bar with the largest vertical distance from this line and adds it as an anchor point.
Each new anchor point is 'snapped' to its actual price and the entire line is globally re-interpolated to maintain a consistent shape. This process repeats until the desired number of points is reached, effectively simplifying the price chart by highlighting the most significant price swings.
Why it may be useful
By reducing price complexity to a few key turning points, traders can more easily visualize and understand underlying market trends without getting lost in minor price fluctuations. The algorithm provides a clean, simplified view of price action that can help identify important structural changes in market movement.
This approach allows traders to quickly recognize significant price transitions and potential trend shifts, making it easier to make strategic trading decisions based on a more distilled representation of market dynamics.
When to explore it
The PIP algorithm works best in markets with clear trending characteristics, where price movements have distinct directional shifts. It is particularly useful in volatile markets where identifying key turning points can provide critical insights into potential trend reversals or continuation patterns.
Traders should consider using this method when they want to cut through market noise and focus on the most significant price movements, especially during periods of uncertainty or when traditional trend indicators might provide conflicting signals.
Keep exploring
What we’ve verified
Access, alerts and repainting behaviour have not been independently verified for this indicator. Check the creator’s current publication and settings.
General descriptions and classifications are recovered research. Verified details above identify the specific checks we have completed. Check the creator’s current publication for later changes.