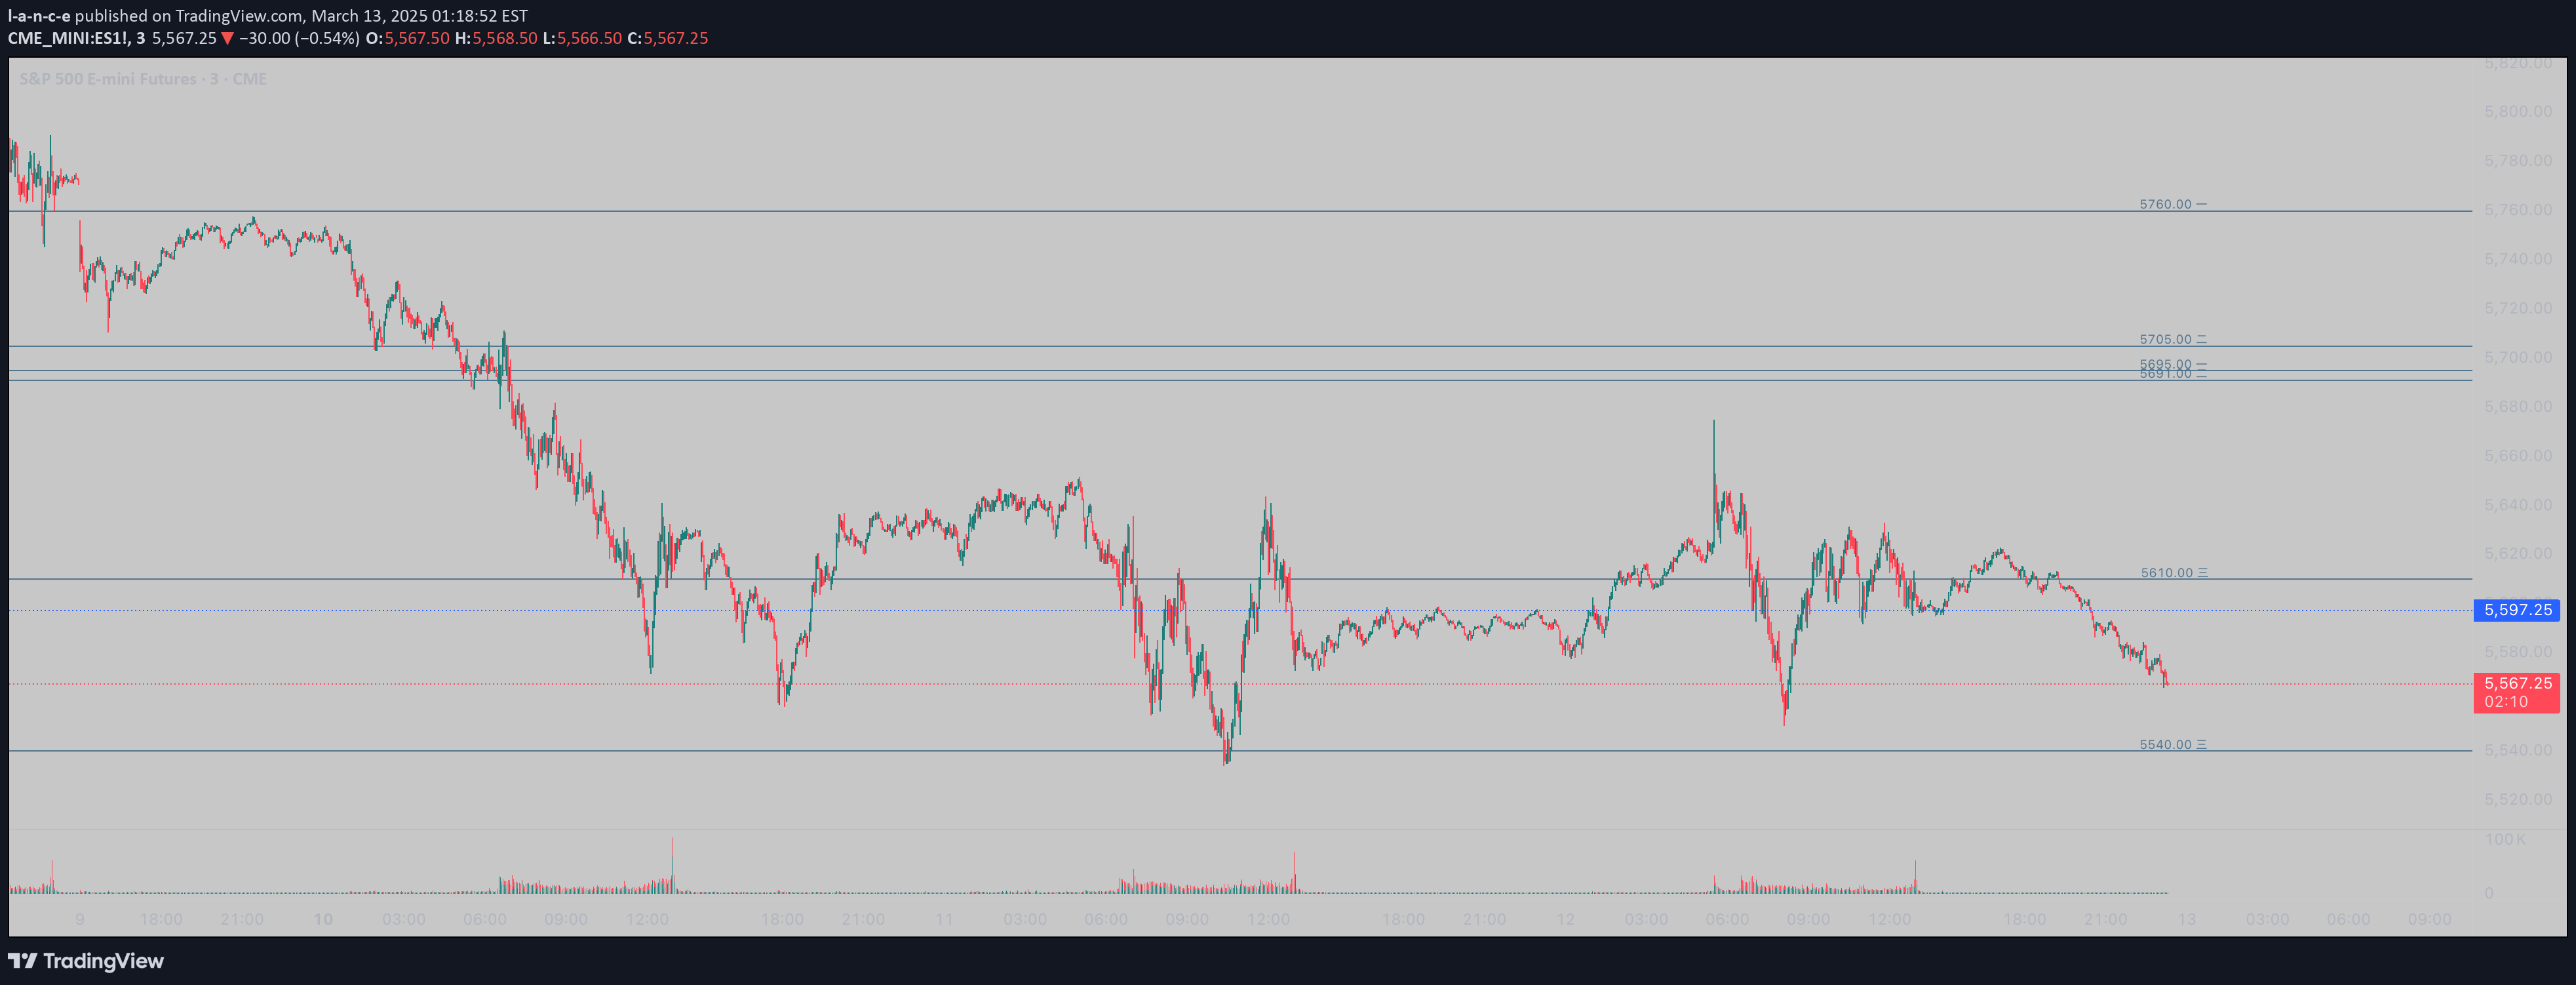
A technical analysis tool identifying significant price levels where market trends might reverse. Pivot points help traders recognize potential turning points in asset price movements.
Explore complementary indicator rolesHow it works
The Pivot High Low indicator identifies critical price levels by analyzing recent price action and determining key turning points in the market. It examines a specific number of price bars before and after a point to determine whether a price represents a significant high or low point.
When a price bar's high is higher than a specified number of surrounding bars, it's considered a Pivot High. Similarly, when a price bar's low is lower than surrounding bars, it becomes a Pivot Low. Traders use these points to understand potential trend reversals and market sentiment.
Why it may be useful
The Pivot High Low indicator provides traders with objective markers of potential market trend changes, reducing emotional decision-making. By highlighting significant price levels, it offers a structured approach to understanding market dynamics and potential entry or exit points.
These pivot points help traders visualize market psychology, revealing where buying or selling pressure might intensify. They serve as crucial reference points for risk management, stop-loss placement, and identifying potential trend reversals in various financial markets.
When to explore it
The Pivot High Low indicator works best in markets with clear directional movements and sufficient price volatility. It is particularly effective in day trading and scalping scenarios where rapid price changes create multiple pivot points. Traders should use this indicator in conjunction with other technical analysis tools for confirmation.
The signal is most reliable in liquid markets like forex, stocks, and futures, where price movements are more predictable. Traders should adapt the indicator's settings to match the specific characteristics of the asset they are trading, considering factors like timeframe and market volatility.
Keep exploring
What we’ve verified
Access, alerts and repainting behaviour have not been independently verified for this indicator. Check the creator’s current publication and settings.
General descriptions and classifications are recovered research. Verified details above identify the specific checks we have completed. Check the creator’s current publication for later changes.