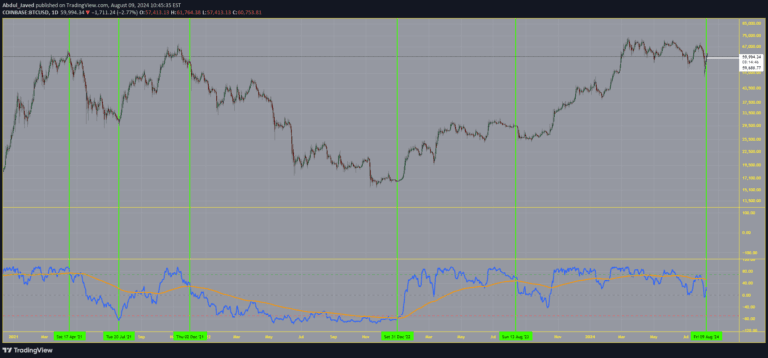
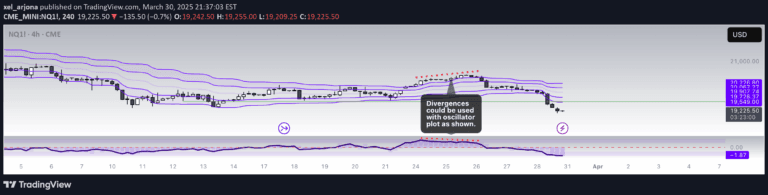
A statistical oscillator that identifies potential market reversals by analyzing pivot point distances and calculating percentile-based thresholds for price movements.
Explore complementary indicator rolesHow it works
The Pivot Length Percentiles Oscillator begins by detecting significant pivot highs and lows using a configurable lookback period. It calculates the absolute price distance between consecutive pivots and builds a historical database of these measurements, tracking both pivot distance and time between pivots.
Using statistical analysis, the indicator generates dynamic thresholds by calculating percentile values from the historical distribution. Two primary oscillator lines are created: a green line measuring price fall below recent highs and a red line measuring price rise above recent lows, which are then compared against these dynamically generated statistical boundaries.
Why it may be useful
Traditional trading indicators often rely on fixed values that don't adapt to changing market conditions, potentially generating less accurate signals. This oscillator addresses that limitation by using a sophisticated statistical approach that dynamically adjusts thresholds based on the complete historical price movement distribution.
By analyzing percentile rankings and movement distances, traders gain a more nuanced understanding of current price action relative to historical patterns. The indicator provides a flexible framework for identifying potential reversals that accounts for the unique characteristics of each trading instrument's price behavior.
When to explore it
The Pivot Length Percentiles Oscillator is most effective in markets with clear trending or ranging characteristics, where price movements exhibit consistent statistical patterns. It works particularly well in liquid markets with sufficient historical data to generate meaningful percentile calculations.
Traders should consider using this indicator in timeframes ranging from minutes to hours, particularly for instruments with relatively stable volatility. It is especially useful for identifying potential trend reversals and measuring the statistical significance of current price movements compared to historical price action.
Keep exploring
What we’ve verified
Access, alerts and repainting behaviour have not been independently verified for this indicator. Check the creator’s current publication and settings.
General descriptions and classifications are recovered research. Verified details above identify the specific checks we have completed. Check the creator’s current publication for later changes.