
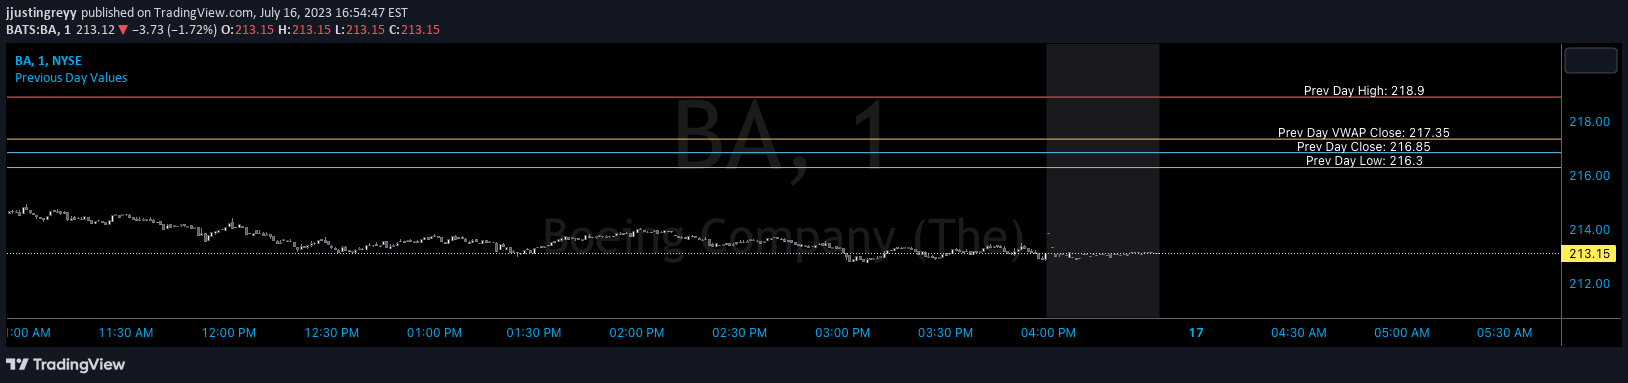
A dynamic indicator tracking previous day's key price levels including high, low, close, and VWAP with customizable visual settings for traders seeking daily reference points.
Explore complementary indicator rolesHow it works
The Previous Day Values Indicator generates horizontal lines representing the previous trading day's crucial price levels, including high, low, close, and VWAP. It uses the request.security function to fetch accurate daily data for the current trading symbol, ensuring real-time updates.
Each price level is color-coded and extends to the right edge of the chart, allowing traders to visually compare current price action against previous day's reference points. The script dynamically updates at the start of each new trading day, automatically removing previous lines and drawing new ones based on the most recent data.
Why it may be useful
This indicator provides traders with essential context by visualizing previous day's price dynamics, helping them understand market sentiment and potential support/resistance levels. By displaying high, low, close, and VWAP levels, traders can quickly assess where current price stands relative to the previous day's trading range.
The color-coded lines and matching labels offer an intuitive way to track price movements, making it easier for traders to make informed decisions. Its customizable nature allows users to focus on the specific price levels most relevant to their trading strategy.
When to explore it
The Previous Day Values Indicator is most effective for day traders and scalpers who require immediate insights into recent market movements and potential entry or exit points. It works particularly well in volatile markets where understanding previous day's price levels can provide critical trading signals.
Traders can benefit from this tool during periods of market uncertainty, when clear reference points help guide trading decisions. It is especially useful in identifying potential support and resistance levels, trend continuation, or reversal scenarios based on the previous day's price action.
Keep exploring
What we’ve verified
Access, alerts and repainting behaviour have not been independently verified for this indicator. Check the creator’s current publication and settings.
General descriptions and classifications are recovered research. Verified details above identify the specific checks we have completed. Check the creator’s current publication for later changes.


