A trading indicator that identifies price action trends by analyzing swing highs and lows, providing color-coded trend signals based on historical price movement.
Explore complementary indicator rolesHow it works
The Price-Action Candles indicator works by identifying swing highs and lows over a specified length, typically 5 bars. It determines these swing points by comparing a candle to surrounding bars, ensuring at least 5 lower bars on both sides for a swing high, and 5 higher bars on both sides for a swing low.
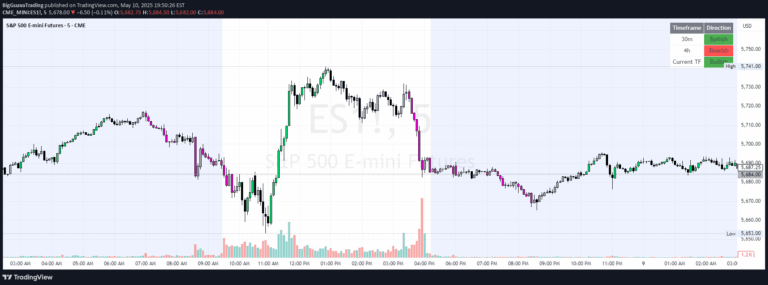
The trend coloring is calculated by comparing current price action to historical swing levels. The algorithm checks for higher highs, lower lows, and current price positions relative to previous swing points. This creates a dynamic color-coding system where green indicates bullish momentum, red signals bearish momentum, and yellow represents potential trend transitions.
Why it may be useful
This indicator helps traders quickly visualize market trend dynamics by providing an intuitive color-based representation of price action. By transforming complex price movement analysis into a simple color scheme, traders can rapidly interpret market sentiment and potential trend shifts without extensive manual calculation.
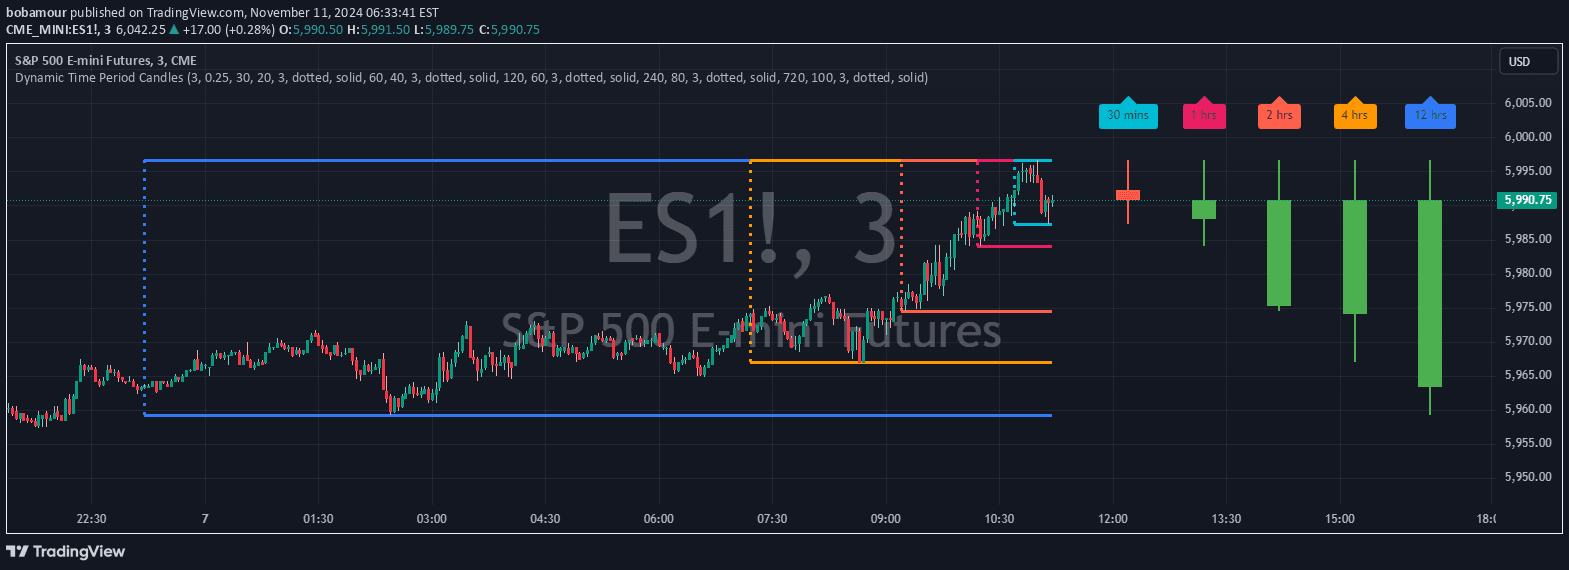
The multi-timeframe analysis feature allows traders to simultaneously view trend characteristics across different time horizons, enabling a more comprehensive market understanding. This holistic approach helps traders make more informed decisions by revealing consistent or conflicting trend signals across various timeframes.
When to explore it
The Price-Action Candles indicator is most effective in markets with clear trending characteristics, such as forex, futures, and liquid stock markets. It performs best during periods of sustained directional movement, where swing highs and lows can be clearly identified and trend transitions are more predictable.
Traders should utilize this indicator alongside other technical analysis tools to confirm signals and reduce false trend interpretations. It is particularly useful for traders seeking to understand market momentum, identify potential entry and exit points, and gauge overall market sentiment across multiple timeframes.
Keep exploring
What we’ve verified
Access, alerts and repainting behaviour have not been independently verified for this indicator. Check the creator’s current publication and settings.
General descriptions and classifications are recovered research. Verified details above identify the specific checks we have completed. Check the creator’s current publication for later changes.