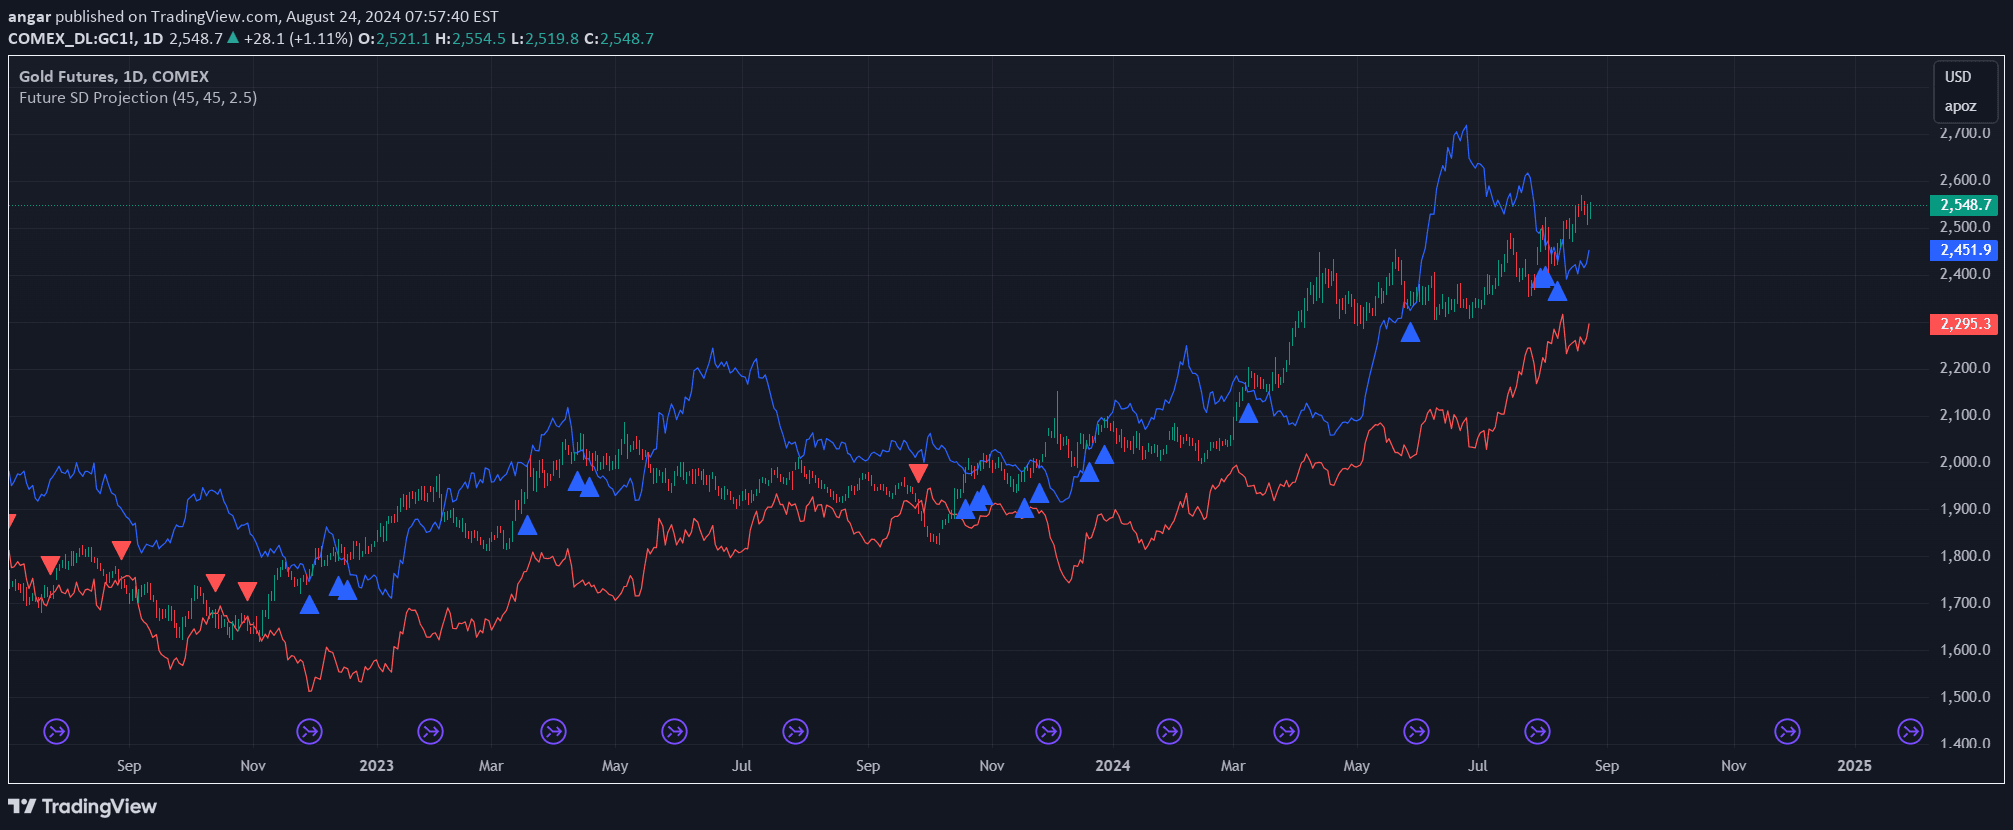
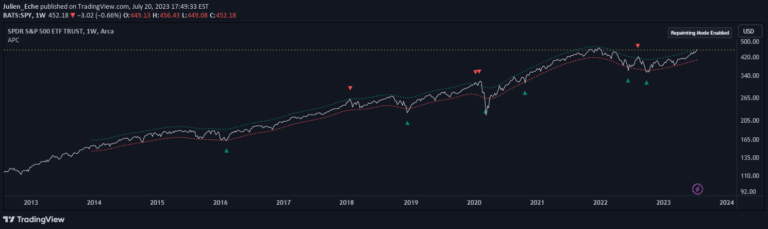
A price channel indicator that uses Average True Range to create multiple volatility-based bands, helping traders visualize market price ranges and potential trend zones.
Explore complementary indicator rolesHow it works
The indicator calculates volatility using the Average True Range (ATR) over a specified period, typically 30 bars. It creates three progressively wider price channels based on the previous bar's closing price, adjusting the upper and lower boundaries according to the calculated volatility coefficient.
Each channel is visually distinguished by different colors and transparency levels, with the base channel having solid colors and the extended channels becoming increasingly transparent. The channels expand by 8% and 16% from the base channel, providing traders with a dynamic view of potential price movement ranges.
Why it may be useful
Volatility channels help traders understand market dynamics by providing a visual representation of price movement potential. They offer insights into market behavior, allowing traders to assess potential price ranges and identify zones of increased or decreased market activity.
By displaying multiple channel levels with varying transparency, the indicator helps traders make more informed decisions about market conditions, potential trend reversals, and entry or exit points. This visualization can improve risk management and strategic trading approaches.
When to explore it
This indicator is most effective in markets with significant price fluctuations, where understanding volatility can provide a competitive edge. It works well across different timeframes and asset classes, making it versatile for various trading strategies and market conditions.
Traders can use the channels to identify potential breakout zones, assess market volatility, and determine optimal entry and exit points. The multiple channel levels allow for a nuanced approach to market analysis, helping traders adapt to changing market dynamics.
Keep exploring
What we’ve verified
Access, alerts and repainting behaviour have not been independently verified for this indicator. Check the creator’s current publication and settings.
General descriptions and classifications are recovered research. Verified details above identify the specific checks we have completed. Check the creator’s current publication for later changes.