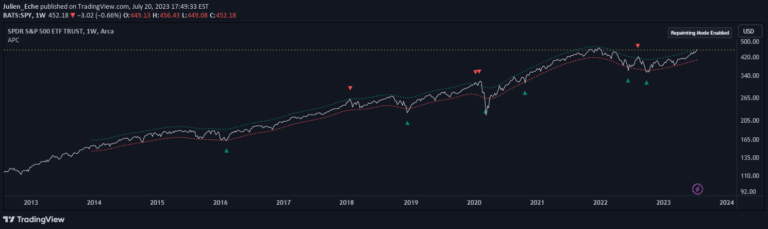
A price range estimator using historical volatility to predict potential price movement boundaries for the next seven days and next day.
Explore complementary indicator rolesHow it works
The Volatility Price Range calculates potential price boundaries by leveraging historical volatility data. It uses a sophisticated formula that transforms annual volatility into weekly and daily volatility metrics through a square root time scaling approach.
By applying the calculated volatility values to the current price, the indicator generates upper and lower price range bands. These bands are derived by adding and subtracting the weekly/daily volatility values from the current market price, effectively creating a predictive price range framework.
Why it may be useful
The Volatility Price Range provides traders with a dynamic perspective on potential price movement boundaries, helping them understand market volatility and potential risk zones. By translating historical volatility into actionable price ranges, traders can make more informed decisions about market entry and exit points.
This approach offers a quantitative method to assess market uncertainty and potential price fluctuations, enabling traders to develop more strategic and risk-aware trading plans across different timeframes and market conditions.
When to explore it
The Volatility Price Range is most effective in markets with consistent volatility patterns and during periods of predictable price movements. It works particularly well for traders seeking to understand potential price range boundaries before entering a trade.
Traders should utilize this indicator in conjunction with other technical analysis tools to confirm signals and validate potential market movements. It is especially useful in markets with clear trending characteristics and when evaluating potential risk and reward scenarios.
Keep exploring
What we’ve verified
Access, alerts and repainting behaviour have not been independently verified for this indicator. Check the creator’s current publication and settings.
General descriptions and classifications are recovered research. Verified details above identify the specific checks we have completed. Check the creator’s current publication for later changes.