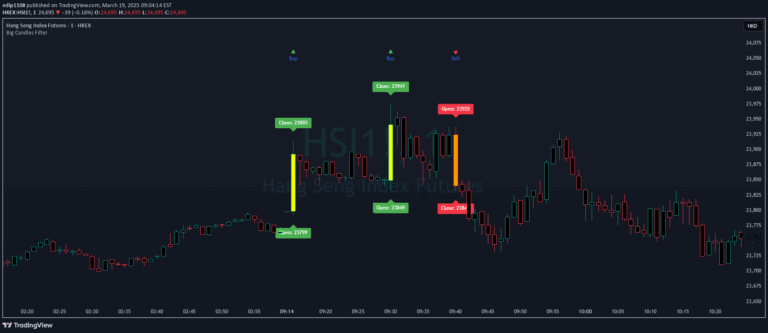
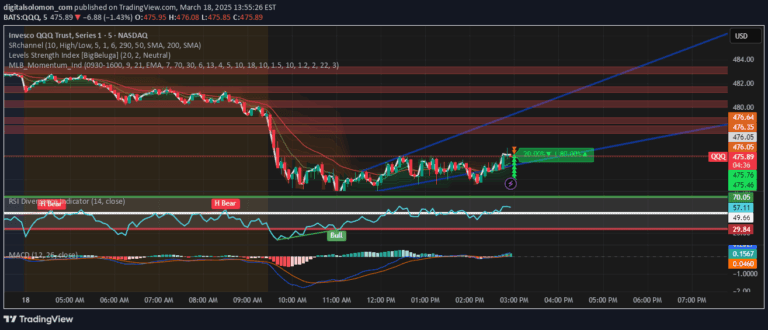
An indicator that calculates the average size of candles over 1000 periods to assess market volatility and potential price movement dynamics.
Explore complementary indicator rolesHow it works
The average candle size indicator systematically measures the size of each candle within a 1000-period window, computing the mean length to represent overall market volatility. It tracks the vertical distance between a candle's high and low points, creating a comprehensive view of price fluctuations across the selected timeframe.
By aggregating these measurements, traders can understand the typical price range and potential market movement magnitude. The calculation provides a numerical representation of how much prices typically move, helping traders gauge the current market's energy and potential for significant price changes.
Why it may be useful
Understanding candle size helps traders assess market volatility and potential trading opportunities by revealing the typical price movement range. This metric provides insights into market sentiment, showing whether prices are consistently making large or small movements during specific periods.
By tracking average candle size, traders can adapt their strategies to current market conditions, set more accurate stop-loss and take-profit levels, and manage risk more effectively. The indicator serves as a valuable tool for understanding market dynamics and potential price behavior.
When to explore it
The average candle size indicator is most effective during periods of consistent market activity, where price movements follow recognizable patterns. Traders can use this indicator to compare current market volatility against historical norms, identifying potential shifts in market behavior.
It works particularly well in markets with established trends and during timeframes with predictable trading volumes. Traders should combine this indicator with other technical analysis tools to confirm signals and develop more robust trading strategies.
Keep exploring
What we’ve verified
Access, alerts and repainting behaviour have not been independently verified for this indicator. Check the creator’s current publication and settings.
General descriptions and classifications are recovered research. Verified details above identify the specific checks we have completed. Check the creator’s current publication for later changes.