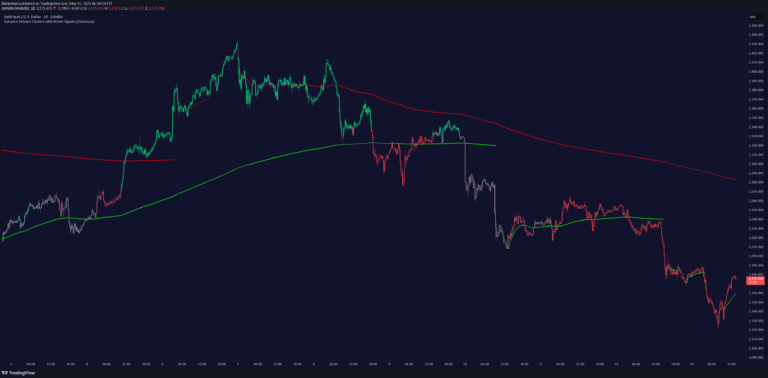
Range Tightening Indicator tracks price volatility, identifying low-volatility consolidation periods that potentially signal upcoming market breakouts and momentum shifts.
Explore complementary indicator rolesHow it works
The Range Tightening Indicator (RTI) calculates volatility by measuring the range between each bar's high and low prices over a selected lookback period. Traders can choose between a 5-bar period for short-term momentum, a 15-bar period for swing trading, or a custom 50-bar period for longer-term analysis.
The indicator uses dynamic color coding and visual markers to highlight volatility changes. When volatility drops below 20, the system tracks potential volatility expansion, with green indicators signaling significant volatility shifts and orange dots marking extended low-volatility periods.
Why it may be useful
The RTI provides traders with a nuanced understanding of market volatility, helping them anticipate potential breakout conditions before they occur. By quantifying price range and tracking volatility shifts, traders can make more informed decisions about market entry and potential momentum changes.
This indicator is particularly valuable because it transforms complex volatility data into easily interpretable visual signals. The color-coded zones and dynamic markers allow traders to quickly assess market conditions, supporting more strategic and data-driven trading approaches.
When to explore it
The Range Tightening Indicator is most effective during periods of market consolidation when prices are trading within a tight range. Traders should pay special attention to the indicator when the RTI line shows values below 20, signaling potential upcoming volatility expansion and breakout opportunities.
The indicator works well across multiple timeframes and asset classes, making it versatile for scalpers, day traders, and swing traders. It is especially useful when combined with other technical analysis tools to confirm potential trend reversals or momentum shifts.
Keep exploring
What we’ve verified
Access, alerts and repainting behaviour have not been independently verified for this indicator. Check the creator’s current publication and settings.
General descriptions and classifications are recovered research. Verified details above identify the specific checks we have completed. Check the creator’s current publication for later changes.