A volatility-based momentum indicator that identifies low volatility periods and potential breakout points by combining Bollinger Bands and Keltner Channels with price momentum analysis.
Explore complementary indicator rolesHow it works
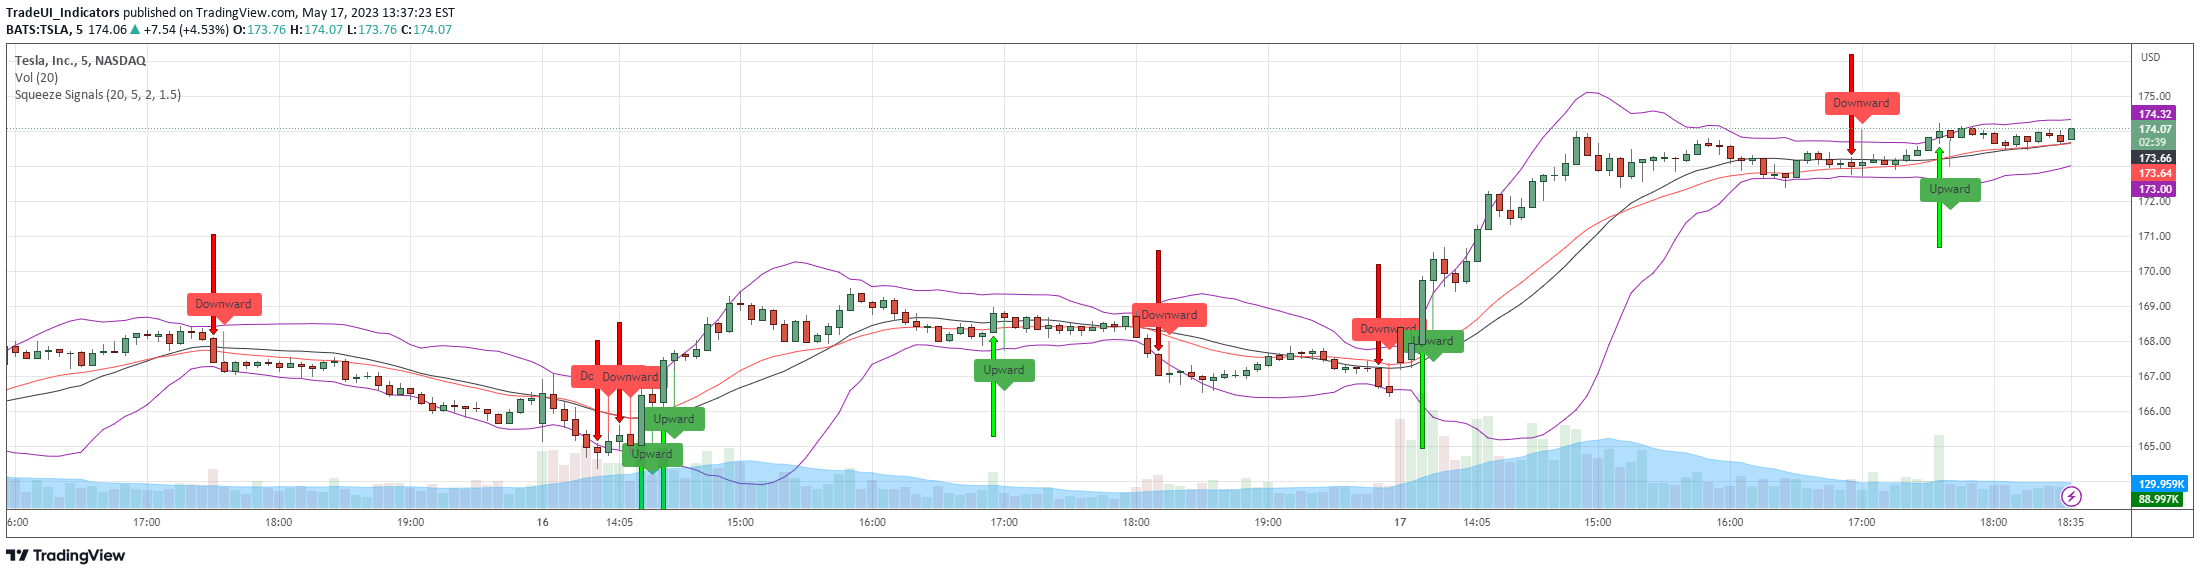
The Squeeze Momentum Indicator (SMI) first detects periods of low volatility by comparing Bollinger Bands and Keltner Channels. When these channels tighten, it signals a potential market squeeze, indicating reduced price movement and potential upcoming volatility. The indicator then incorporates a momentum calculation based on the rate of price change to provide additional trading insights.
By analyzing the speed and direction of price movement, the SMI helps traders identify potential breakout opportunities. When the price increases or decreases rapidly, the indicator generates signals that suggest the potential strength and direction of market momentum, allowing traders to anticipate possible trend reversals or continuations.
Why it may be useful
The Squeeze Momentum Indicator offers traders a comprehensive view of market conditions by combining volatility analysis with momentum assessment. By detecting low volatility periods, traders can prepare for potential significant price movements and make more informed trading decisions. The indicator helps identify periods of market compression and potential breakout scenarios.
Unlike traditional single-dimensional indicators, the SMI provides a multi-faceted approach to market analysis. It not only highlights periods of low volatility but also measures the speed of price changes, giving traders a more nuanced understanding of market dynamics and potential trading opportunities.
When to explore it
The Squeeze Momentum Indicator is most effective in markets with identifiable trend patterns and moderate volatility. It works best in trading environments where price movements are not extremely erratic but have potential for significant directional shifts. Traders should look for instances where the indicator shows a compression of volatility followed by a clear momentum signal.
This indicator is particularly useful in day trading and scalping scenarios where quick identification of potential price breakouts is crucial. Traders should combine the SMI with other technical analysis tools to confirm signals and reduce false positive readings, especially in more volatile or unpredictable market conditions.
Keep exploring
What we’ve verified
Access, alerts and repainting behaviour have not been independently verified for this indicator. Check the creator’s current publication and settings.
General descriptions and classifications are recovered research. Verified details above identify the specific checks we have completed. Check the creator’s current publication for later changes.