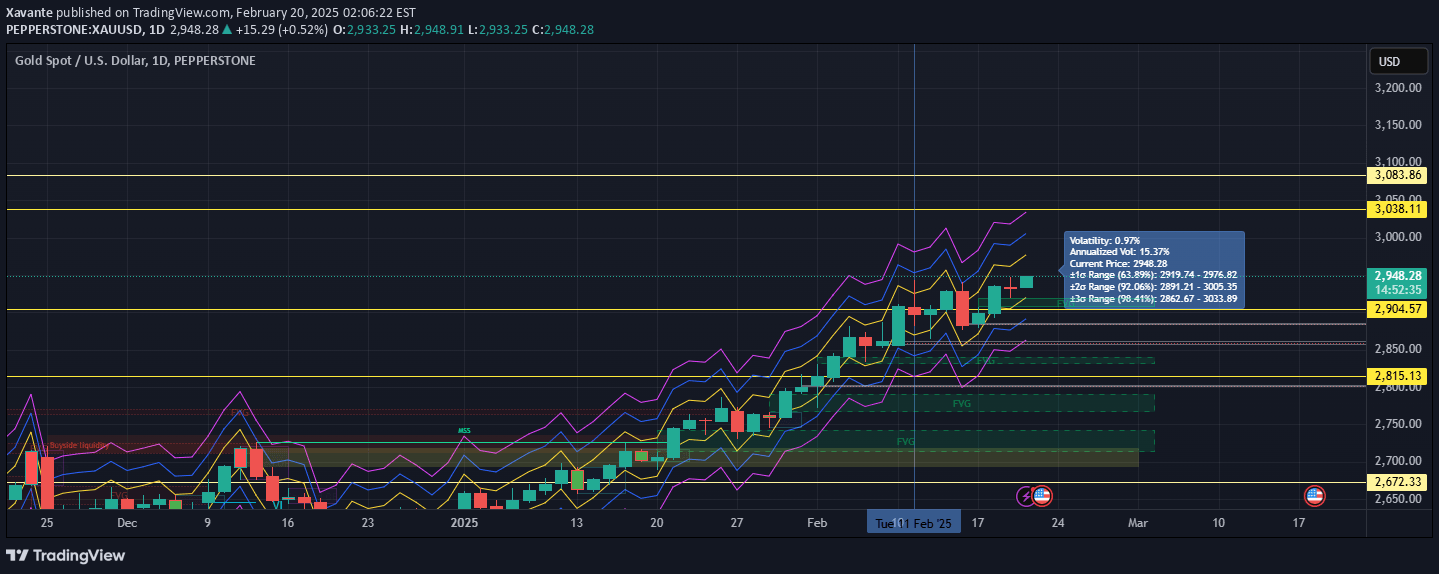
A momentum indicator that uses Bollinger Bands and Keltner Channels to identify market compression and potential trend shifts with dynamic color-coded signals.
Explore complementary indicator rolesHow it works
The Squeeze Momentum TD works by analyzing market volatility through a combination of Bollinger Bands and Keltner Channels to detect periods of price compression. It calculates momentum using a linear regression-based oscillator that tracks the speed and direction of price movement.
The indicator generates visual signals through color changes, transitioning between light and dark green or red to indicate shifts in market momentum. These color transformations help traders quickly identify potential trend changes, with specific color progressions suggesting bullish or bearish momentum shifts.
Why it may be useful
The Squeeze Momentum TD provides traders with a sophisticated tool for understanding market dynamics by combining volatility analysis with momentum tracking. It offers a unique visual representation of market conditions, allowing traders to quickly interpret complex price movements and potential trend reversals.
By integrating multiple technical analysis concepts, this indicator helps traders make more informed decisions about market entry and exit points. Its adaptable design and comprehensive alert system enable traders to customize their analysis and respond quickly to changing market conditions.
When to explore it
The Squeeze Momentum TD is most effective in markets with clear momentum shifts and periods of price compression. It works exceptionally well in trending markets where volatility changes can signal significant price movements, making it valuable for traders across different timeframes and asset classes.
Traders should pay special attention to rapid color transitions, which indicate sudden momentum changes and potential trading opportunities. The indicator is particularly useful during market transitions, helping traders identify potential trend reversals and momentum acceleration before they become widely apparent.
Keep exploring
What we’ve verified
Access, alerts and repainting behaviour have not been independently verified for this indicator. Check the creator’s current publication and settings.
General descriptions and classifications are recovered research. Verified details above identify the specific checks we have completed. Check the creator’s current publication for later changes.