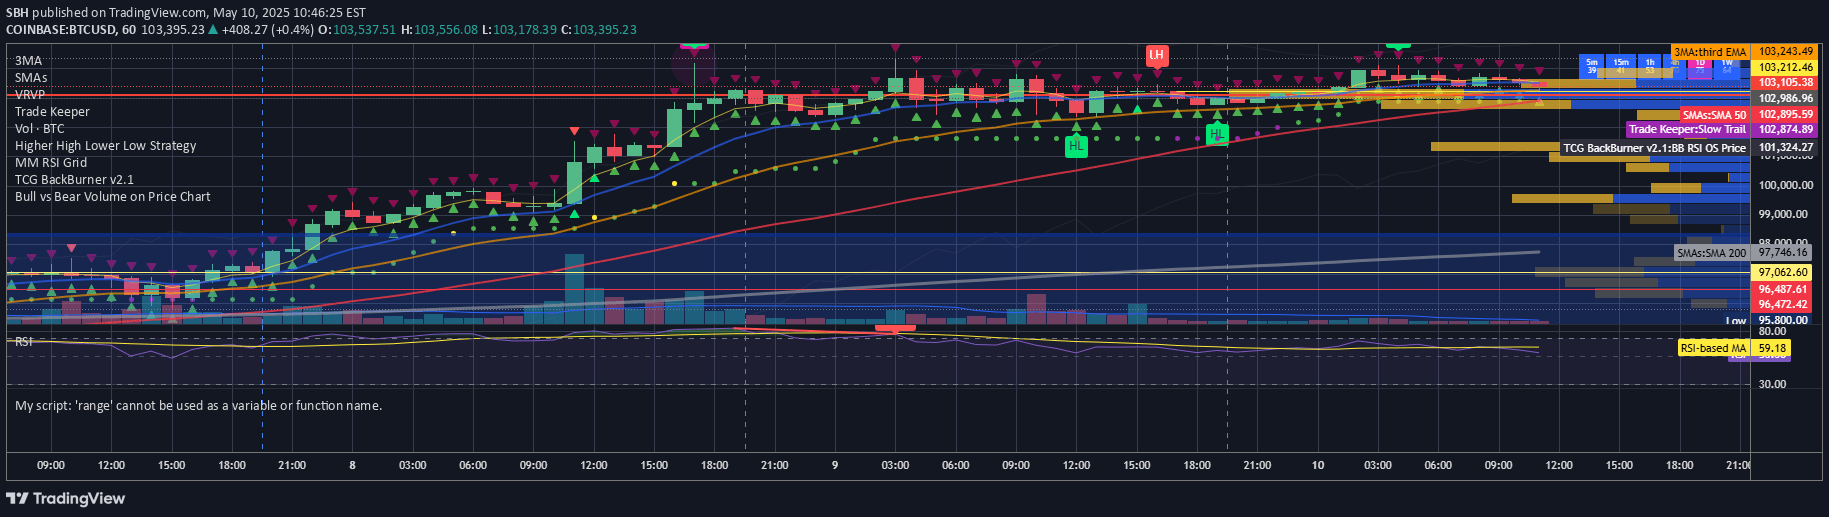
A volume-sensitive indicator that reveals price movement changes through bars, helping traders understand market dynamics and identify potential trend shifts.
Explore complementary indicator rolesHow it works
The indicator analyzes price changes in relation to trading volume, creating visual bars at the bottom of the chart. These bars represent the sensitivity of price movements to volume, allowing traders to interpret market dynamics through graphical representation.
By tracking how price changes correlate with volume, the indicator helps visualize the strength and potential direction of market movements. The bars provide a quick, intuitive way to understand the underlying market sentiment and potential trend momentum.
Why it may be useful
Volume-sensitive indicators are crucial for traders seeking to understand market psychology and confirm price movements. They provide insights into the conviction behind price changes, helping traders distinguish between meaningful trends and potential false breakouts.
By integrating volume analysis with price action, traders can make more informed decisions about market entry and exit points. This approach adds an additional layer of confirmation to trading strategies, reducing the likelihood of trading based on misleading price movements.
When to explore it
This indicator works best in markets with clear volume patterns and during periods of significant price movement. Traders should use it when seeking to confirm trend strength and validate potential market reversals.
It is particularly effective in liquid markets with high trading volumes, such as major stock indices, forex pairs, and popular cryptocurrencies. Traders should combine this indicator with other technical analysis tools to create a comprehensive trading strategy.
Keep exploring
What we’ve verified
Access, alerts and repainting behaviour have not been independently verified for this indicator. Check the creator’s current publication and settings.
General descriptions and classifications are recovered research. Verified details above identify the specific checks we have completed. Check the creator’s current publication for later changes.