A versatile price pressure indicator that analyzes market dynamics by calculating price differences and normalizing pressure, helping traders identify potential trend shifts and market conditions.
Explore complementary indicator rolesHow it works
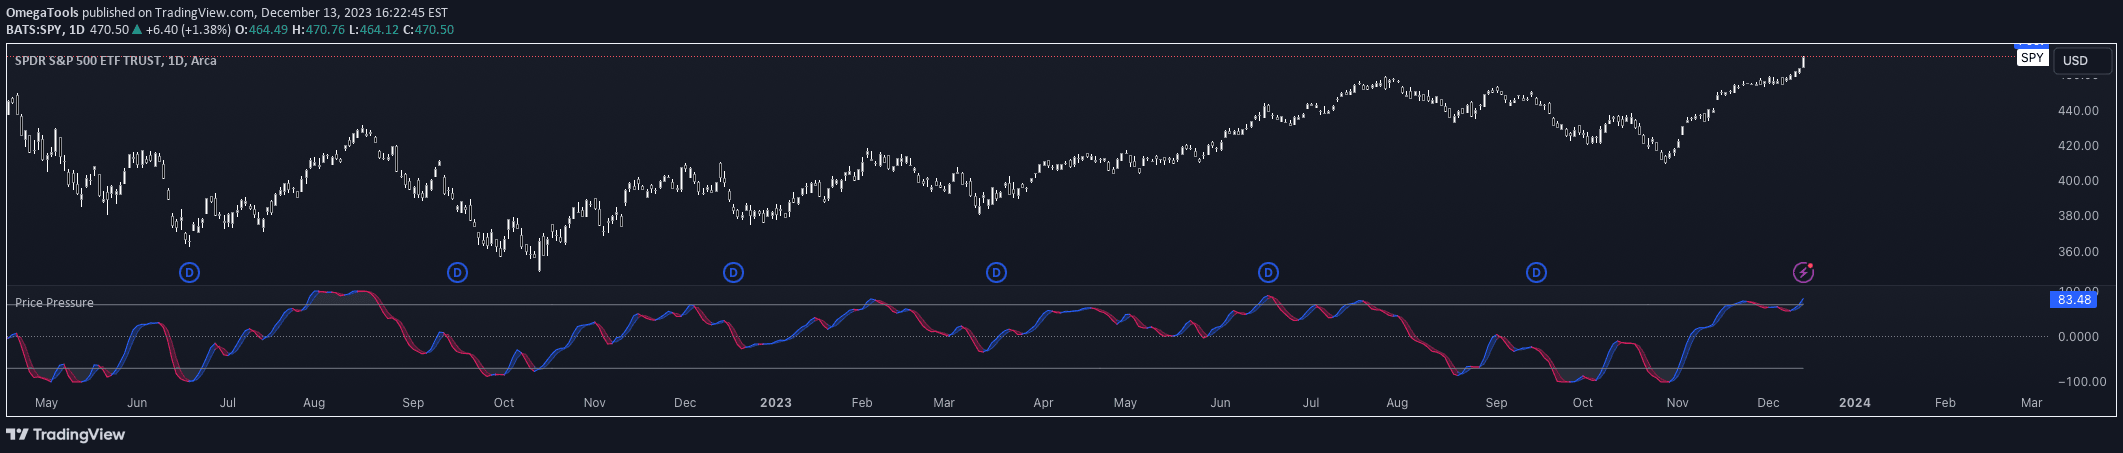
The Price Pressure Indicator calculates market pressure by analyzing the difference between previous high and current close, and the difference between current close and previous low. It employs a normalization function to standardize price data, transforming raw price movements into a standardized oscillator that represents market dynamics.
The indicator uses a customizable length parameter and smoothing techniques to refine its calculations. By tracking these price differences and applying normalization, the script creates a visual representation of market pressure that oscillates around a central line, allowing traders to quickly interpret potential trend shifts and market momentum.
Why it may be useful
The Price Pressure Indicator provides traders with a nuanced understanding of market conditions by quantifying price movements beyond traditional trend analysis. By offering a normalized view of market pressure, it helps traders identify potential trend reversals, momentum changes, and underlying market sentiment more effectively than standard price charts.
Its flexibility in configuration, including adjustable length and extension parameters, allows traders to customize the indicator to their specific trading style and market conditions. The visual representation of pressure and signal lines enables quick interpretation of market dynamics, making complex price movements more accessible and comprehensible.
When to explore it
The Price Pressure Indicator is most effective in markets with clear directional movements and during periods of potential trend transitions. It performs well in volatile markets where rapid price changes and momentum shifts are common, such as during economic announcements, earnings reports, or significant market events.
Traders can optimize its use by adjusting the length and extension parameters to match specific asset characteristics and trading timeframes. It is particularly useful when combined with other technical indicators to confirm signals, validate trend strength, and provide a more comprehensive view of market conditions across different trading styles.
Keep exploring
What we’ve verified
Access, alerts and repainting behaviour have not been independently verified for this indicator. Check the creator’s current publication and settings.
General descriptions and classifications are recovered research. Verified details above identify the specific checks we have completed. Check the creator’s current publication for later changes.