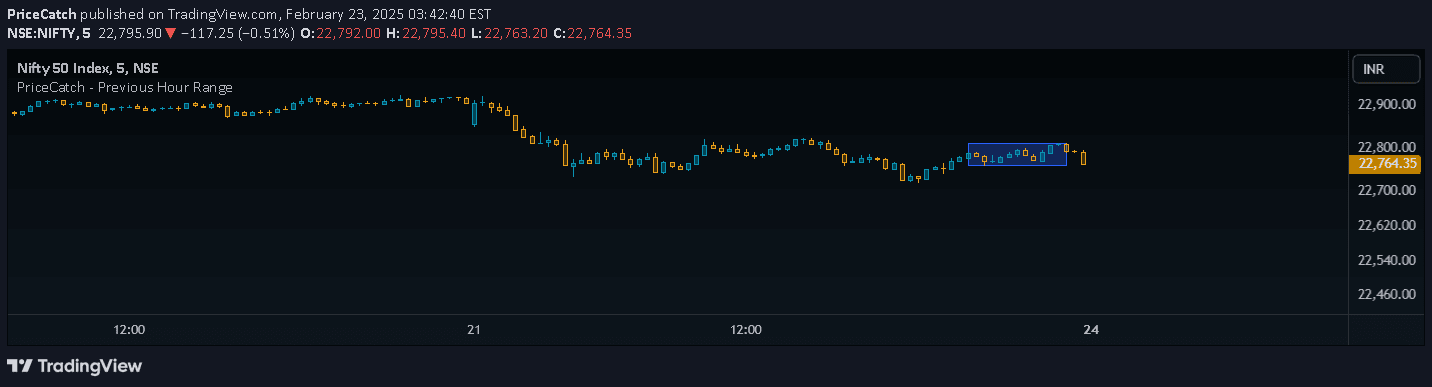
PriceCatch is a simple trading script that plots the previous hour's price range, providing traders with a basic reference for intraday trading analysis and potential entry points.
Explore complementary indicator rolesHow it works
The PriceCatch script calculates and plots the price range of the previous trading hour directly on the price chart. It identifies the highest and lowest price points within the last complete hour, creating a visual reference for traders to understand recent price movement and potential support and resistance levels.
Traders can easily modify the time frame by changing the input value, allowing flexibility in analyzing different hourly ranges. The script provides a straightforward visual tool that helps traders quickly assess recent price behavior without complex calculations or multiple indicator requirements.
Why it may be useful
Understanding the previous hour's price range is crucial for traders seeking to identify potential entry and exit points in the market. By visualizing the recent price extremes, traders can gain insights into market volatility, momentum, and potential support or resistance levels that might influence future price action.
The simplicity of the PriceCatch script makes it accessible to traders of all skill levels, providing a clear and immediate visual representation of recent price dynamics. This can help traders make more informed decisions by offering a quick snapshot of recent market behavior without overwhelming them with complex technical analysis.
When to explore it
The PriceCatch script is most effective during active trading hours with consistent price movement, particularly in liquid markets like forex, stocks, and cryptocurrencies. It works best for intraday and scalping strategies where understanding recent price ranges can provide quick insights into potential trading opportunities.
Traders should use this script in conjunction with other technical analysis tools and consider market conditions, news events, and overall trend direction. It is particularly useful during periods of moderate volatility where recent price ranges can indicate potential breakout or reversal points in the market.
Keep exploring
What we’ve verified
Access, alerts and repainting behaviour have not been independently verified for this indicator. Check the creator’s current publication and settings.
General descriptions and classifications are recovered research. Verified details above identify the specific checks we have completed. Check the creator’s current publication for later changes.