
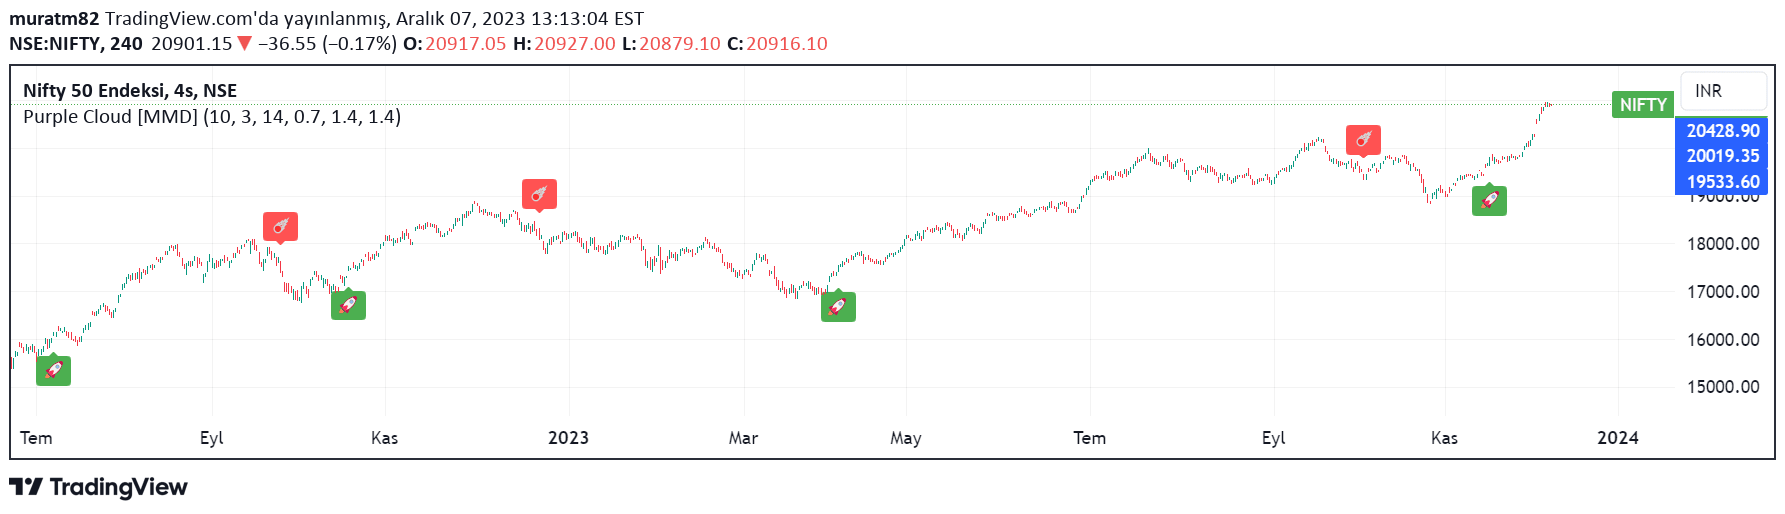
A complex trading signal that calculates modified moving averages and creates multiple displaced plots using price and volatility parameters to generate potential trading insights.
Explore complementary indicator rolesHow it works
This signal begins by calculating modified exponential moving averages (EMA) of high and low price series, creating unique derivative measurements. It uses complex mathematical transformations including square root calculations and comparisons of current and historical price points to generate intermediate values.
The indicator then creates multiple plot lines displaced by different multiples of the Average True Range (ATR), each with consistent transparency. These displaced plots provide visual representations of price dynamics and potential trend variations, allowing traders to observe multiple layers of price movement simultaneously.
Why it may be useful
This signal offers a sophisticated approach to analyzing price movements by integrating multiple computational techniques that go beyond traditional moving average calculations. By leveraging both exponential and simple moving averages alongside advanced mathematical transformations, it provides traders with a nuanced view of market dynamics.
The multi-layered plotting approach allows traders to detect subtle price variations and potential trend shifts that might be missed by simpler indicators. Its complex methodology can reveal hidden market insights and provide more comprehensive trend analysis compared to standard single-line indicators.
When to explore it
This signal is most effective in markets with clear directional movements and moderate volatility, where price trends are not extremely erratic. It works best on timeframes ranging from short-term intraday charts to daily charts, providing valuable insights for active traders seeking comprehensive trend analysis.
Traders should consider using this signal during periods of steady market conditions, avoiding extremely choppy or news-driven markets where price movements might be unpredictable. It is particularly useful for traders who appreciate mathematically derived indicators and want a more sophisticated approach to trend identification.
Keep exploring
What we’ve verified
Access, alerts and repainting behaviour have not been independently verified for this indicator. Check the creator’s current publication and settings.
General descriptions and classifications are recovered research. Verified details above identify the specific checks we have completed. Check the creator’s current publication for later changes.


