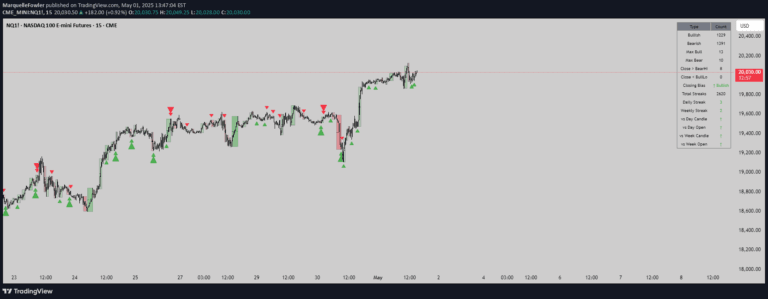
A trading signal based on chart patterns that has been rigorously backtested over five years to validate its reliability and performance across different market conditions.
Explore complementary indicator rolesHow it works
Chart pattern trading signals are developed by identifying recurring geometric shapes and formations in price movement that suggest potential future price action. These patterns are meticulously analyzed using historical data to recognize statistically significant relationships between specific chart configurations and subsequent market movements.
The backtesting process involves systematically applying the pattern recognition algorithm across multiple years of market data to validate its predictive accuracy and reliability. By examining how these patterns performed historically, traders can develop a robust strategy that leverages statistical probabilities and market psychology.
Why it may be useful
Chart pattern trading signals provide traders with a structured approach to market analysis that goes beyond subjective interpretation by using data-driven methodologies. These signals help traders identify potential trend reversals, continuation patterns, and high-probability trading opportunities by revealing underlying market dynamics.
By relying on proven historical patterns, traders can make more informed decisions, reduce emotional trading, and develop a systematic approach to market entry and exit. The extensive backtesting ensures that the signal has demonstrated consistent performance across different market conditions, enhancing trader confidence and risk management.
When to explore it
Chart pattern trading signals are most effective in markets with clear trend structures and sufficient liquidity, where price movements tend to exhibit more predictable behavioral characteristics. They work best in markets like forex, major stock indices, and highly traded commodities where large participant volumes create more reliable pattern formations.
Traders should be particularly attentive to these signals during periods of stable market conditions, avoiding their use during extreme volatility or major economic announcements. The signals are most powerful when combined with other technical and fundamental analysis tools, providing a comprehensive approach to market interpretation.
Keep exploring
What we’ve verified
Access, alerts and repainting behaviour have not been independently verified for this indicator. Check the creator’s current publication and settings.
General descriptions and classifications are recovered research. Verified details above identify the specific checks we have completed. Check the creator’s current publication for later changes.