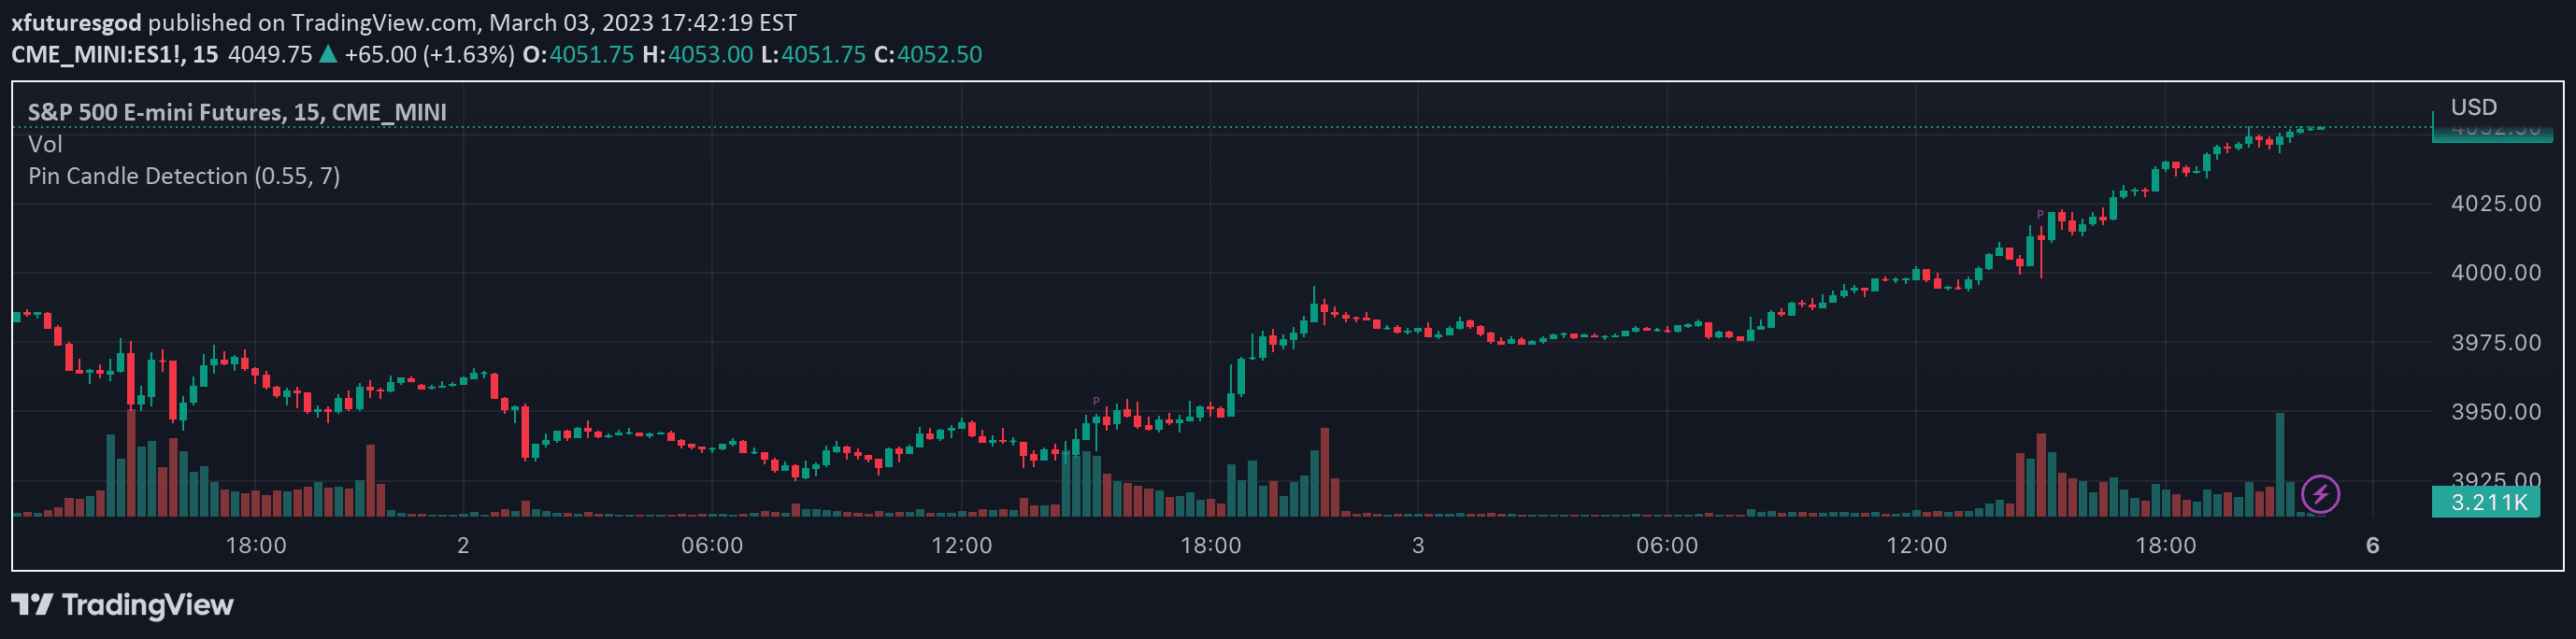
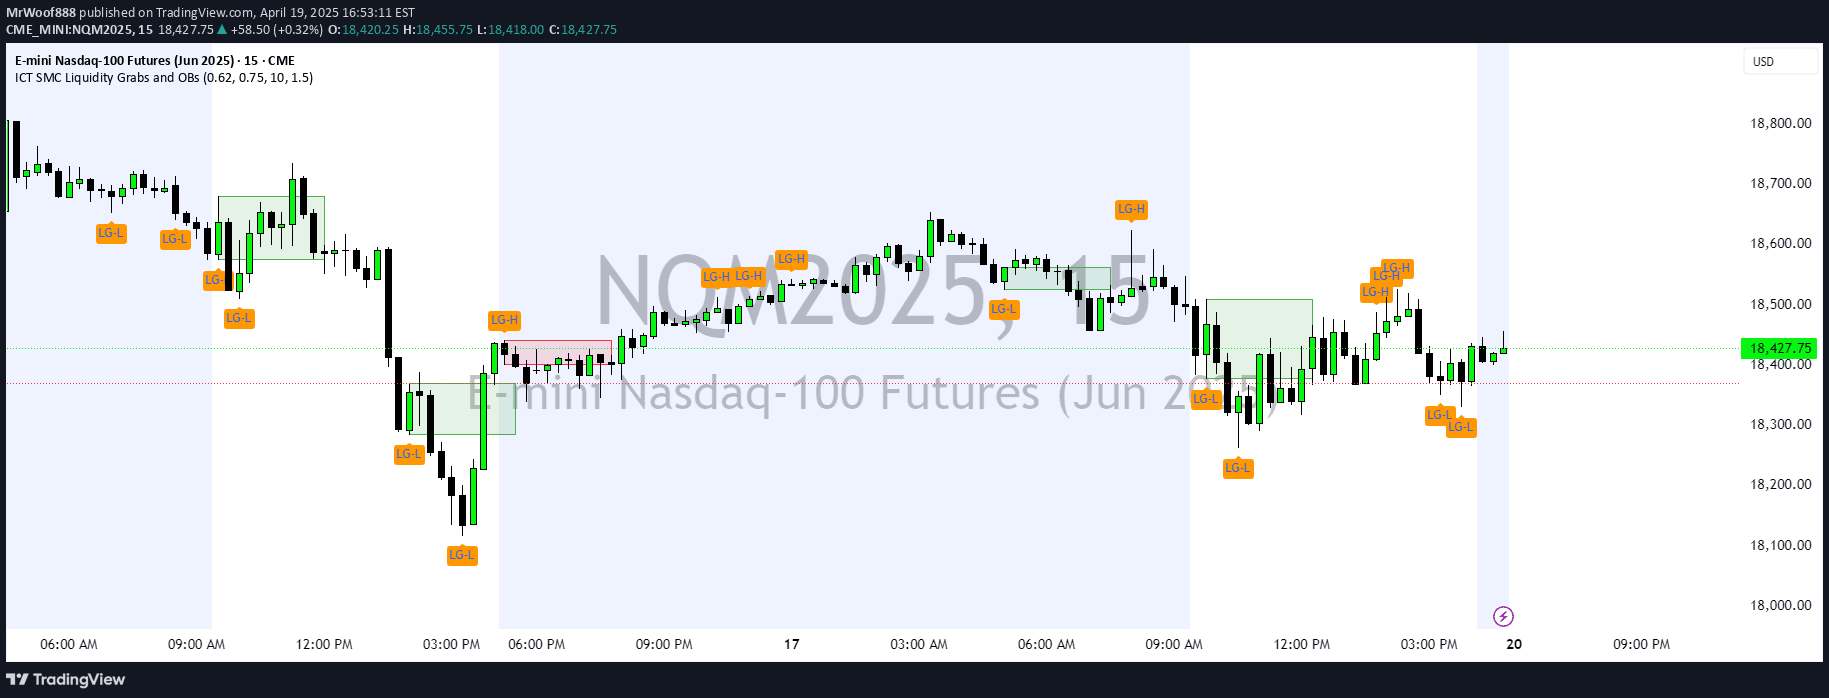
A technical indicator that identifies potential supply and demand zones using price action pattern recognition across multiple timeframes and trading levels.
Explore complementary indicator rolesHow it works
The TD Supply & Demand Points Indicator operates by analyzing specific candle formations to detect potential institutional trading activity and market reversal points. It uses two primary detection modes: Level 1, a basic 3-candle pattern for faster signals, and Level 2, an advanced 5-candle pattern designed for higher probability trading setups.
At Level 1, the indicator identifies supply points when the middle candle's high is higher than surrounding candles, and demand points when the middle candle's low is lower than surrounding candles. Level 2 expands this analysis by examining longer sequences showing distribution or accumulation patterns, offering more nuanced and potentially more reliable signal generation.
Why it may be useful
The TD Supply & Demand Points Indicator provides traders with a systematic approach to identifying potential market turning points and institutional trading zones. By recognizing specific price action patterns, traders can gain insights into potential market sentiment shifts and areas where significant buying or selling pressure might emerge.
This approach helps traders move beyond simple price tracking by identifying more complex market dynamics. The indicator's ability to work across multiple timeframes and offer different sensitivity levels makes it a versatile tool for understanding market structure and potential entry or exit points.
When to explore it
The TD Supply & Demand Points Indicator is most effective when used in conjunction with other technical analysis tools and within a comprehensive trading strategy. Traders should look for confluence with key support and resistance levels, and consider the broader market context and prevailing trend when interpreting signals.
The indicator performs best when applied to liquid markets with clear price action and when traders pay attention to volume and overall market dynamics. Level 1 settings provide more frequent signals suitable for active traders, while Level 2 offers higher-probability setups for more patient, strategic traders.
Keep exploring
What we’ve verified
Access, alerts and repainting behaviour have not been independently verified for this indicator. Check the creator’s current publication and settings.
General descriptions and classifications are recovered research. Verified details above identify the specific checks we have completed. Check the creator’s current publication for later changes.