Volume Profile Volume Delta OI Delta [Kioseff Trading]
A trading indicator that calculates volume delta and open interest delta, providing insights into market sentiment and trading activity across different price levels and asset types.
Explore 11,183 indicators. Filter beyond the obvious.
Discover the tools that fit the way you trade.
11,183 tools to explore
A trading indicator that calculates volume delta and open interest delta, providing insights into market sentiment and trading activity across different price levels and asset types.
An indicator that identifies divergences between swing points of a chart symbol and two external tickers, providing statistical insights into price behavior correlation.
A generalized Gaussian filter that smooths price data with variable pole orders, reducing noise and high-frequency market movements using advanced signal processing techniques.
Footprint IQ Pro is an advanced trading indicator that analyzes volume delta, imbalances, and volume profile at tick levels for precise market insights and trading decisions.
An advanced indicator analyzing open interest flows and price sentiment using Elder-Ray concept to assess market activity, trader positioning, and potential trend dynamics.
SMT Divergence identifies trend reversals by comparing price movements between two correlated financial assets, revealing potential market turning points through strategic divergence analysis.
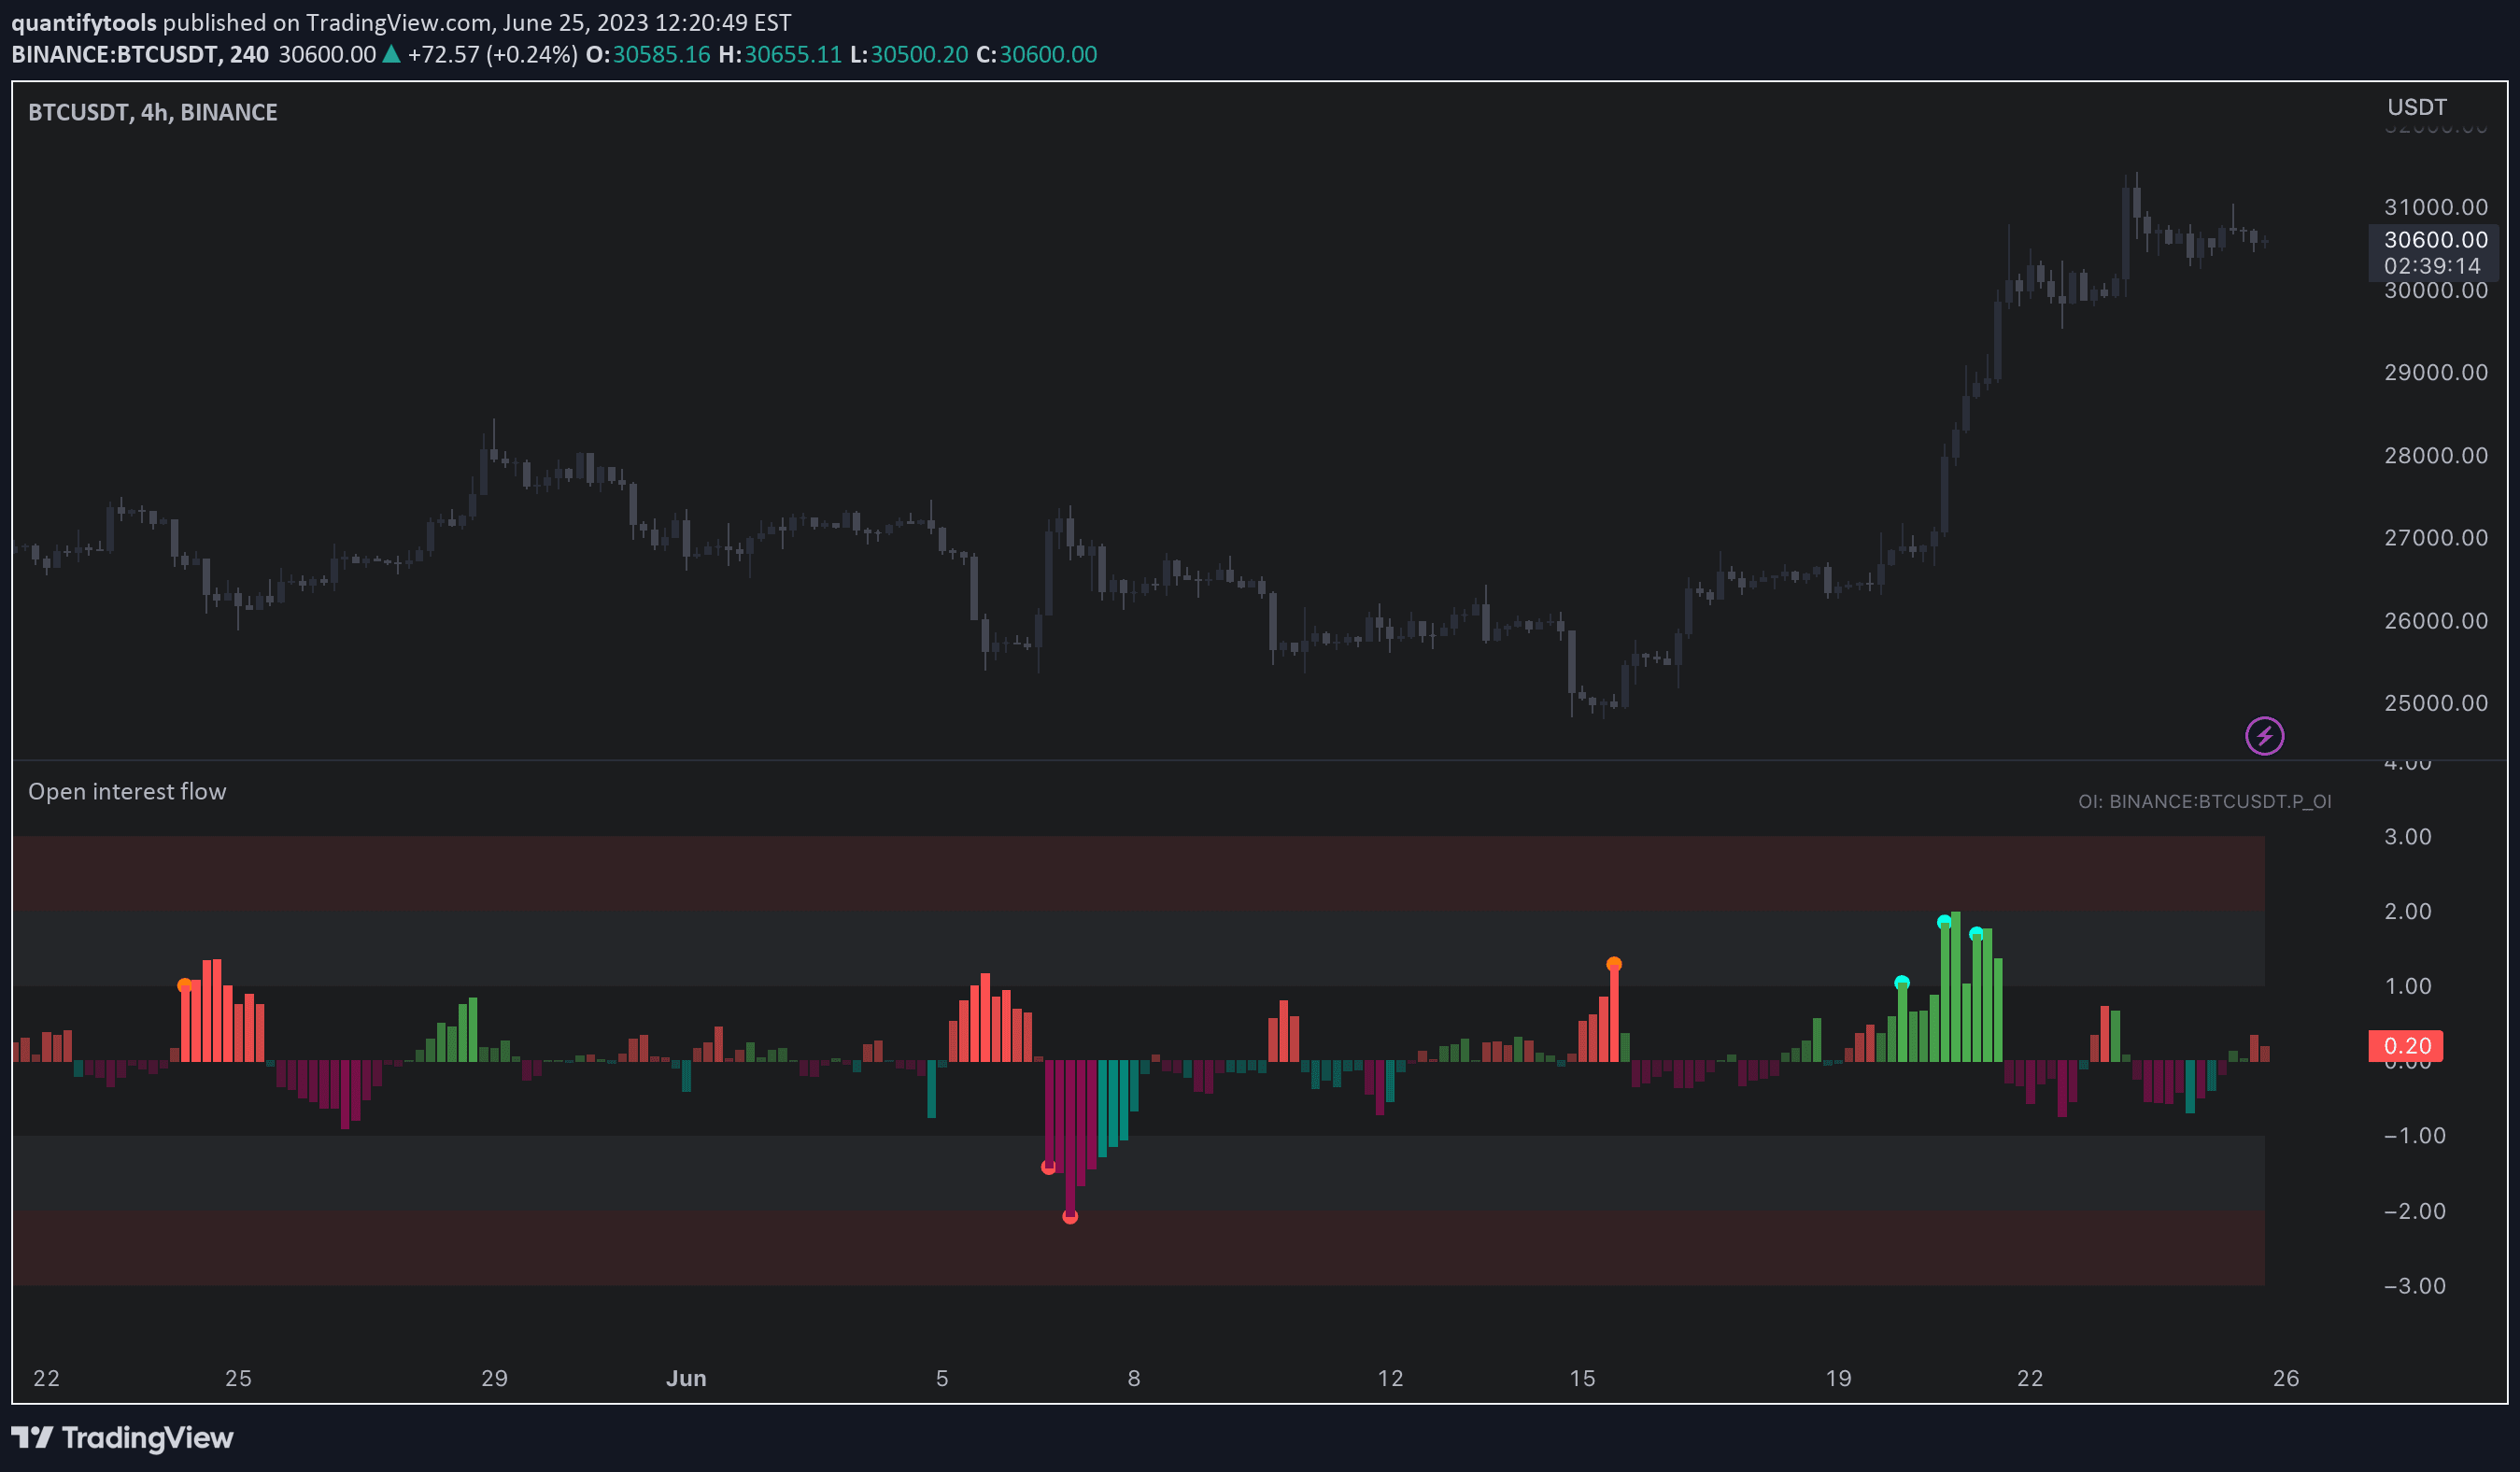
Open interest flow indicator detecting market sentiment by analyzing position openings and closings, revealing potential exuberance or liquidation moments in trading.
SMT Divergence identifies potential market reversals by comparing price behaviors between two correlated assets, revealing subtle signs of market manipulation and trend shifts.
An advanced RSI indicator that dynamically determines the most profitable RSI length through machine learning techniques, adapting to changing market conditions and optimizing trading signals.
A trading indicator combining Double Exponential Moving Average (DEMA) with Relative Strength Index (RSI) to generate responsive trend and momentum signals across different market conditions.
An advanced open interest profile indicator that visualizes price movement and volume trends across different market conditions, using color-coded profiles to highlight price and OI dynamics.
A market range indicator that identifies trading session boundaries and potential daily high/low points using predefined and custom time ranges for traders.
Likes, views, and comments are historical TradingView snapshots. They describe attention, not trading performance.