
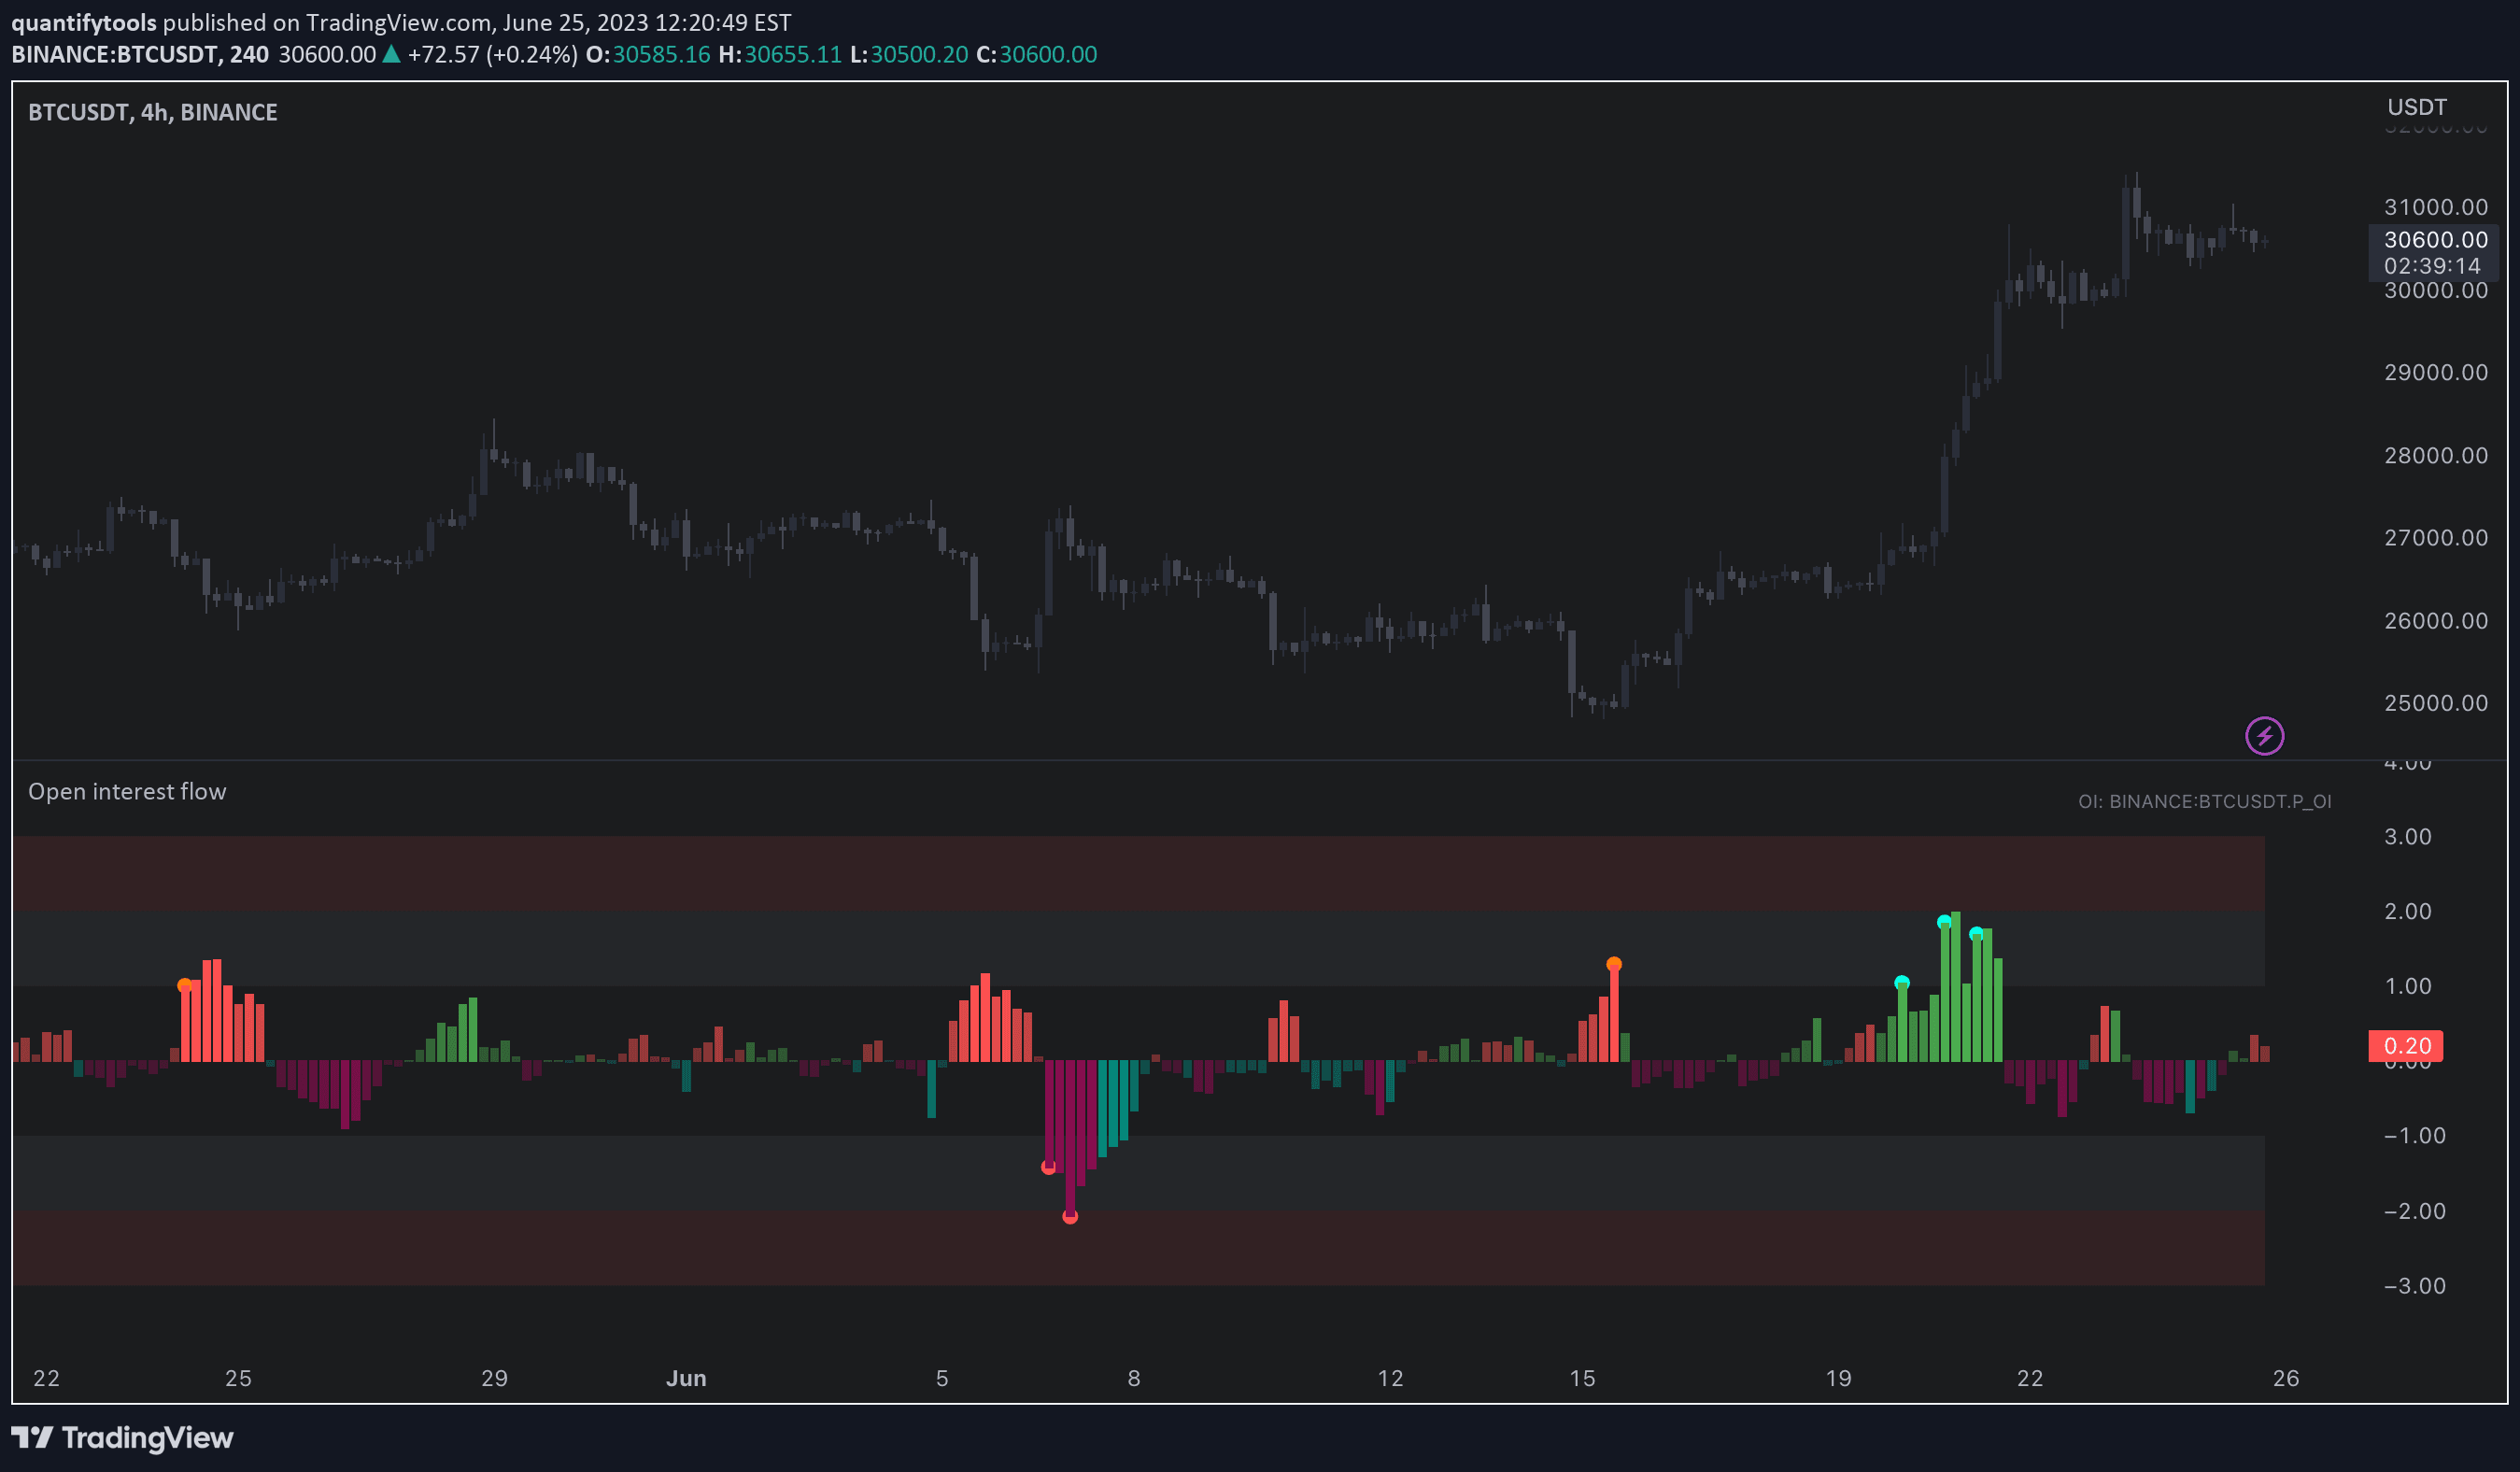
Open interest flow indicator detecting market sentiment by analyzing position openings and closings, revealing potential exuberance or liquidation moments in trading.
Explore complementary indicator rolesHow it works
Open interest flow calculates market sentiment by tracking open interest relative to its moving average and comparing it with price movement. When open interest is above its moving average and price is rising, it indicates long positions entering the market. Conversely, when open interest is declining and price falls, it suggests longs are exiting positions.
The indicator uses relative open interest and relative price to determine market participant behavior, creating flow bands that represent typical market movement magnitudes. These bands are categorized from +1 to +2 for inflows and -1 to -2 for outflows, with extreme levels indicating aggressive position opening or forced position closing.
Why it may be useful
Open interest flow provides traders with deeper insights into market psychology by revealing the underlying sentiment behind price movements. It helps identify moments of market exuberance or potential liquidation events that might not be apparent from price action alone. By understanding these flow dynamics, traders can make more informed decisions about market entry and exit points.
The indicator goes beyond traditional price analysis by showing how market participants are positioning themselves, whether through aggressive buying, selling, or forced exits. This additional layer of information can help traders anticipate potential trend reversals or confirm existing market momentum.
When to explore it
Open interest flow is most effective in volatile markets with significant participant activity, particularly in cryptocurrency and derivatives trading. Traders should use this indicator when seeking to understand underlying market sentiment during trending or ranging markets. It works best when combined with other technical analysis tools to confirm signals and provide a comprehensive market view.
The indicator is particularly useful during periods of rapid price movement, where understanding participant behavior can provide an edge in trading decisions. Traders should pay special attention to extreme flow levels (+2 or -2) that might indicate potential market turning points or significant sentiment shifts.
Keep exploring
What we’ve verified
Access, alerts and repainting behaviour have not been independently verified for this indicator. Check the creator’s current publication and settings.
General descriptions and classifications are recovered research. Verified details above identify the specific checks we have completed. Check the creator’s current publication for later changes.


