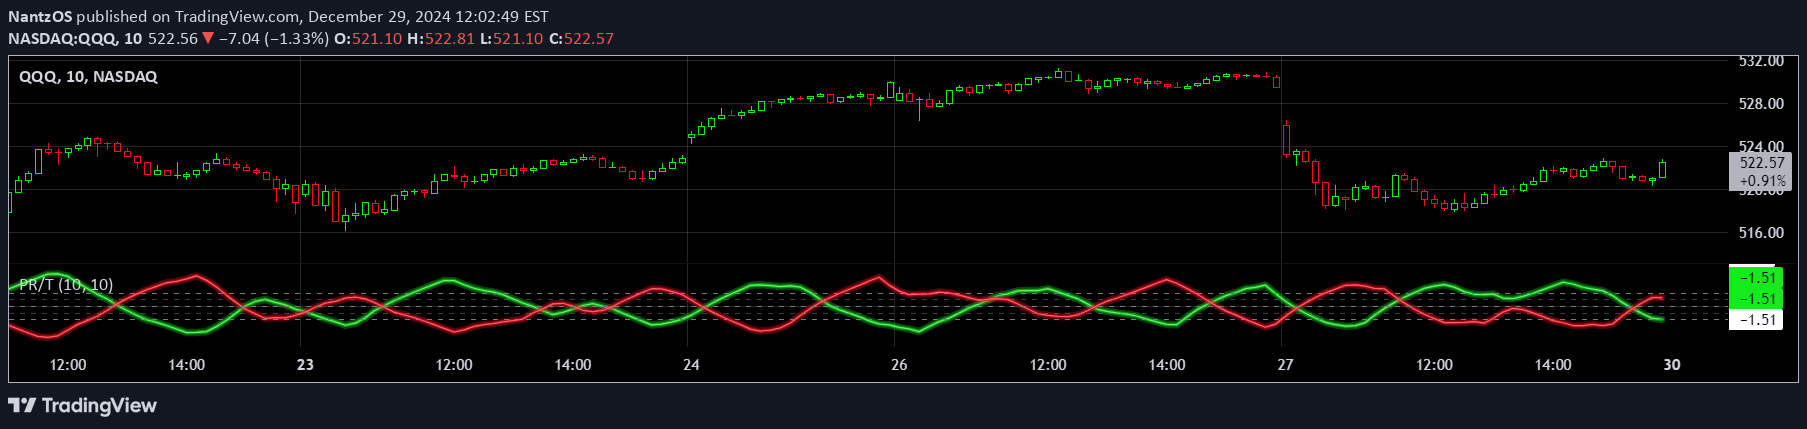
A dynamic oscillator measuring market dynamics by separating positive and negative price shifts, providing nuanced insights into price range movements and momentum.
Explore complementary indicator rolesHow it works
The indicator calculates relative movements of upward and downward price shifts over a specified period, creating two distinct oscillators. It uses a smoothing transform to normalize raw price data, filtering out insignificant fluctuations while maintaining sensitivity to price extremes.
By isolating high and low ranges, the indicator generates separate signals for positive and negative price movements. The zero line serves as a central reference point, with deviations indicating market momentum and potential trend shifts.
Why it may be useful
This oscillator provides traders with a granular view of market dynamics by separating positive and negative price movements. It offers enhanced insights beyond traditional indicators, allowing for more precise identification of potential trend reversals and market extremes.
By offering a nuanced perspective on price ranges, the indicator helps traders understand underlying market sentiment and momentum. Its ability to highlight overbought and oversold conditions makes it a valuable tool for identifying potential entry and exit points across different trading strategies.
When to explore it
The indicator is most effective in markets with clear directional movements and distinct price ranges. It performs well in volatile markets where price fluctuations are significant and traders need a comprehensive view of momentum shifts.
Traders should use this oscillator in conjunction with other technical indicators to confirm signals and develop robust trading strategies. It is particularly useful when combined with volume analysis and momentum indicators to create a more comprehensive market assessment.
Keep exploring
What we’ve verified
Access, alerts and repainting behaviour have not been independently verified for this indicator. Check the creator’s current publication and settings.
General descriptions and classifications are recovered research. Verified details above identify the specific checks we have completed. Check the creator’s current publication for later changes.