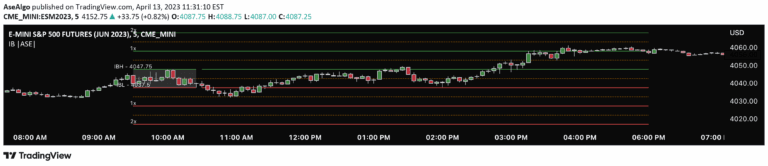
A trading indicator that tracks the first 60 minutes of market trading, identifying key price levels that act as potential attraction and repulsion zones for market movement.
Explore complementary indicator rolesHow it works
The RD Opening Range/Initial Balance indicator tracks the first 60 minutes of trading, establishing high, mid, and low levels for the day. It creates a data panel showing today's opening range value, weekly average, and historical close statistics above and below these key levels. Traders can observe how price interacts with these defined zones throughout the trading session.
The indicator uses price action and trading rules to determine whether price is being attracted to or repelled from these critical levels. By analyzing the market's behavior around these initial range points, traders can gain insights into potential price movements and trading opportunities.
Why it may be useful
This indicator provides traders with a structured approach to understanding market dynamics during the critical opening period. By highlighting key price levels from the first hour of trading, it offers a framework for identifying potential support and resistance zones that can significantly influence subsequent price action.
The opening range levels serve as important reference points that can help traders make more informed decisions about market entry and exit points. By tracking historical performance and current day's price behavior relative to these levels, traders can develop a more nuanced understanding of market sentiment and potential price movements.
When to explore it
The Opening Range indicator is most effective during active trading hours, particularly during the cash market session when price tends to respect these initial levels most strongly. Traders should pay close attention to how price interacts with the established high, mid, and low points throughout the trading day.
This indicator works best when combined with other bias and momentum indicators, such as the RDA, to provide a more comprehensive view of market conditions. It is particularly useful for day traders and scalpers who are looking to capitalize on short-term price movements and market dynamics.
Keep exploring
What we’ve verified
Access, alerts and repainting behaviour have not been independently verified for this indicator. Check the creator’s current publication and settings.
General descriptions and classifications are recovered research. Verified details above identify the specific checks we have completed. Check the creator’s current publication for later changes.