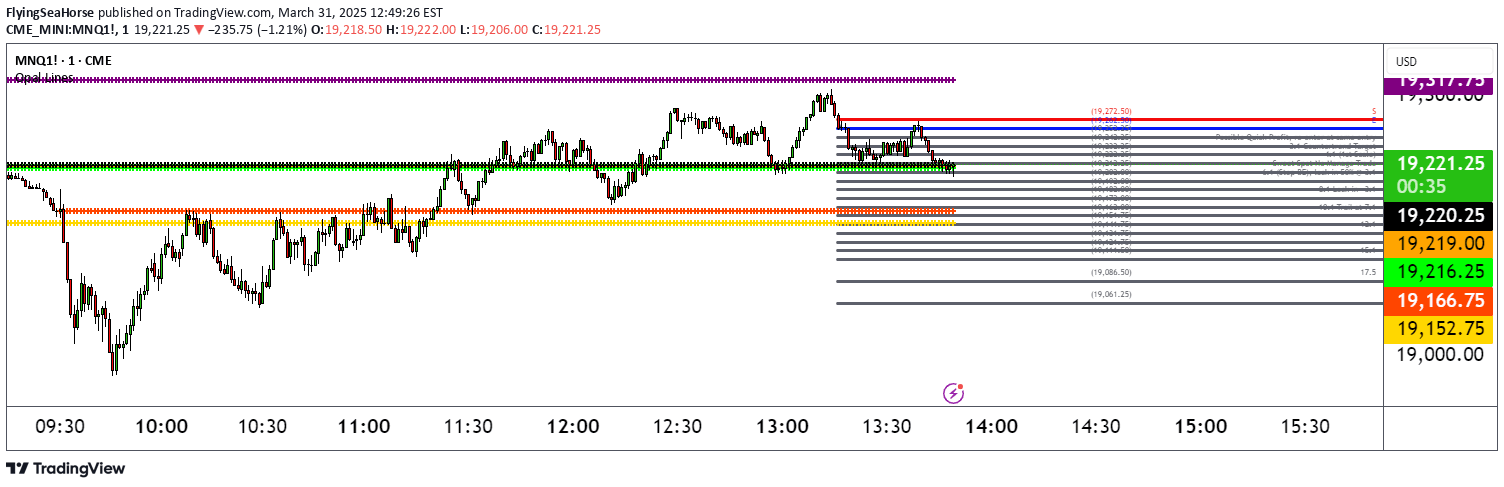
Opal Lines is a dynamic overlay indicator that plots horizontal price levels at key market session opens, providing traders with precise reference points across different global trading sessions.
Explore complementary indicator rolesHow it works
Opal Lines generates horizontal price lines at specific market session openings using Eastern Time (ET). The indicator captures the opening price at precise minute intervals and extends these levels across the chart.
It includes seven toggleable session lines with distinct colors, including European Open, Gold Open, Regular Market Open, and Globex Open. Each line is plotted and persists until the daily reset at 5:00 PM ET, with the Globex line extending overnight. The lines provide visual markers for tracking price movements and session transitions
Why it may be useful
Opal Lines helps traders identify critical price levels and market session dynamics across different financial instruments. By marking key session opens, the indicator provides insights into potential support and resistance zones.
Traders can use these lines to understand market sentiment, detect potential breakouts, and align their strategies with global trading sessions. The color-coded and customizable nature of the lines allows for flexible analysis and easy interpretation of price action
When to explore it
Opal Lines is most effective during high-volume trading periods and when analyzing multiple market sessions. Traders can benefit from this indicator when tracking price interactions with session open levels, such as bounces, breaks, or retests.
It works well across forex, futures, equities, and commodities markets. The indicator is particularly useful for day traders and scalpers who need precise reference points throughout different trading sessions
Keep exploring
What we’ve verified
Access, alerts and repainting behaviour have not been independently verified for this indicator. Check the creator’s current publication and settings.
General descriptions and classifications are recovered research. Verified details above identify the specific checks we have completed. Check the creator’s current publication for later changes.