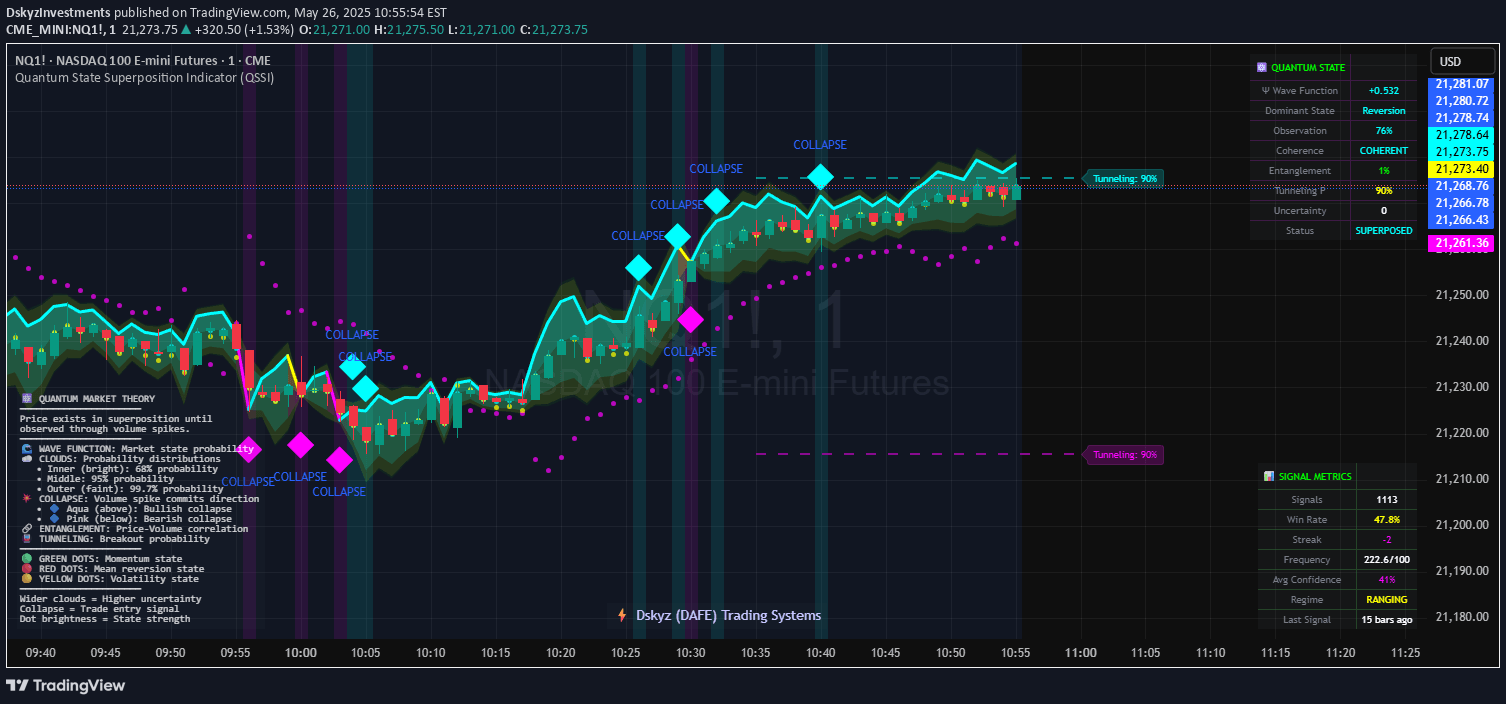
A custom candle range indicator that color-codes candles based on their price range, helping traders identify significant price movements and potential trading opportunities.
Explore complementary indicator rolesHow it works
The script calculates the range of each candle by subtracting the low price from the high price and determines its bullish or bearish nature by comparing the close and open prices. Users can set a custom range threshold, typically 100 points, which defines the minimum price movement required to change a candle's color.
When a candle's range meets or exceeds the specified threshold, it is color-coded accordingly: bullish candles become blue, bearish candles turn orange. Candles that do not meet the range criteria remain uncolored. The indicator also plots triangular markers at the high and low price points to provide additional visual cues about price movement.
Why it may be useful
This indicator helps traders quickly identify significant price movements and potential trading opportunities by visually highlighting candles with substantial range. By color-coding candles based on their price range, traders can rapidly assess market volatility and momentum without extensive manual analysis.
The customizable range parameter allows traders to adapt the indicator to different market conditions and trading styles. This flexibility makes the tool valuable for identifying strong price trends, potential breakouts, and periods of increased market activity across various financial instruments and timeframes.
When to explore it
The candle range indicator is most effective in markets with clear directional movements and significant price volatility. It works best during active trading sessions when price movements are more pronounced, such as during major economic announcements or in markets with high liquidity.
Traders should use this indicator in conjunction with other technical analysis tools to confirm signals and validate potential trading decisions. It is particularly useful for identifying strong trending markets, detecting potential reversals, and assessing the strength of price movements across different timeframes.
Keep exploring
What we’ve verified
Access, alerts and repainting behaviour have not been independently verified for this indicator. Check the creator’s current publication and settings.
General descriptions and classifications are recovered research. Verified details above identify the specific checks we have completed. Check the creator’s current publication for later changes.