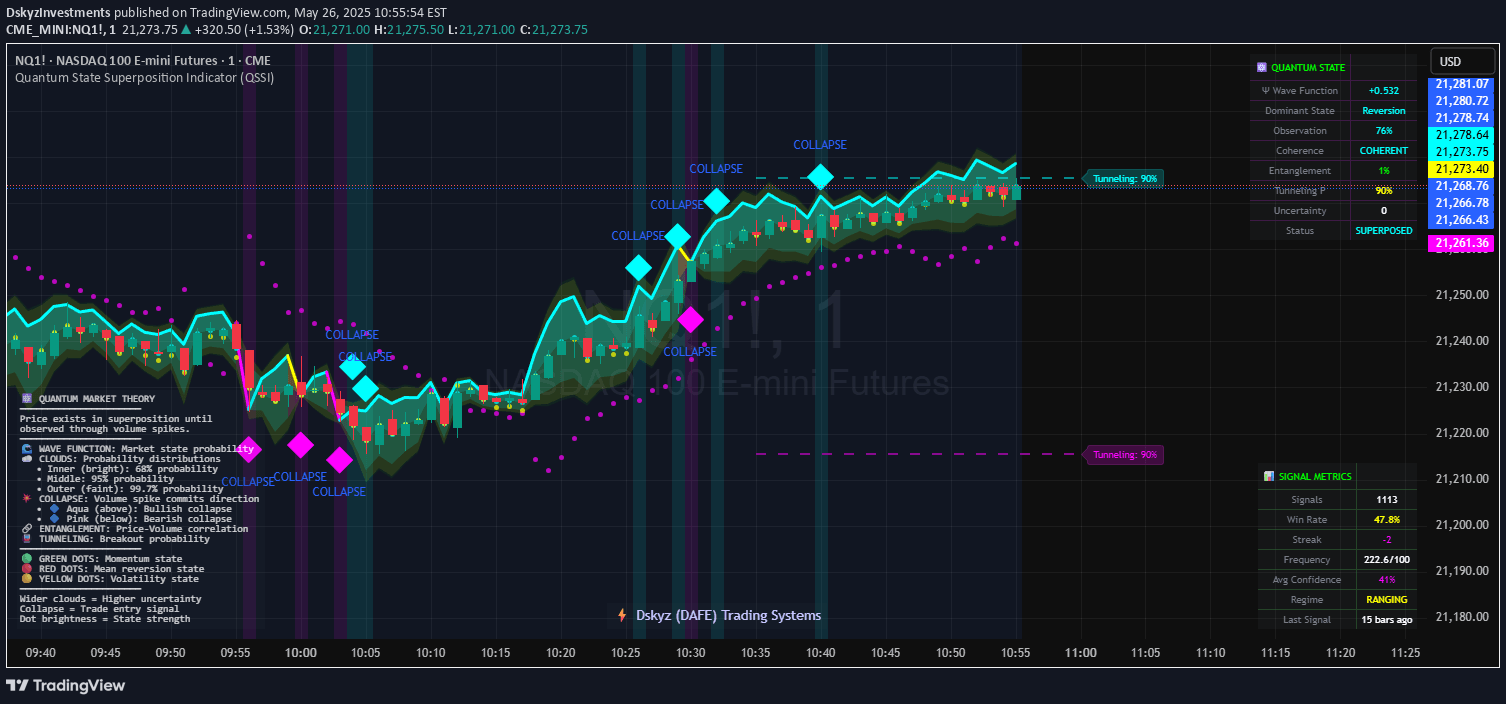
A candlestick signal that identifies price volatility by detecting candles with higher highs and lower lows. Highlights specific patterns visually to help traders spot potential market shifts.
Explore complementary indicator rolesHow it works
The signal operates by comparing consecutive candlesticks to detect specific volatility patterns. It examines the current candle's high and low prices against the previous candle's high and low, creating a precise comparative analysis. When the current candle's high exceeds the prior candle's high and its low is simultaneously lower, the signal is triggered.
Upon meeting these conditions, the candlestick's body is highlighted in blue, providing an immediate visual indicator for traders. This method allows for quick identification of potential market volatility and possible trend reversal signals without requiring complex calculations or additional technical indicators.
Why it may be useful
The signal provides traders with a straightforward method to quickly identify potential market volatility and directional shifts. By highlighting specific candlestick patterns, it offers an intuitive visual representation of price action that can signal important market movements. Traders can use this technique to spot potential trend reversals or periods of increased market uncertainty.
Moreover, the blue highlighting mechanism allows for rapid chart scanning, enabling traders to efficiently review multiple charts and timeframes. This approach reduces the cognitive load of manual pattern recognition, helping traders make faster and more informed trading decisions based on clear, visually distinct market signals.
When to explore it
The signal is most effective in markets with moderate to high volatility, where price movements are more dynamic and less predictable. It works particularly well in day trading and scalping scenarios where quick identification of potential price shifts is crucial. Traders can apply this signal across various financial instruments, including stocks, forex, and cryptocurrency markets.
Optimal usage occurs during periods of market uncertainty or potential trend transitions, such as during news events, earnings releases, or significant economic announcements. Traders should combine this signal with other technical analysis tools to confirm potential trading opportunities and reduce false signal risks.
Keep exploring
What we’ve verified
Access, alerts and repainting behaviour have not been independently verified for this indicator. Check the creator’s current publication and settings.
General descriptions and classifications are recovered research. Verified details above identify the specific checks we have completed. Check the creator’s current publication for later changes.